10 HAZARD TO LIFE ASSESSMENT
10.1 Introduction
10.1.1.1 This section identifies the hazardous scenarios associated with the generation, storage, utilization, processing and transmission (if applicable) of biogas during operation of the Project, and presents the analysis and findings of the Quantitative Risk Assessment (QRA) undertaken.
10.1.1.2 An organic waste co-digestion facility that processes off-site pre-treated organic wastes (approximately 100 wet tonnes / day) and sewage sludge and handles the associated wastewater and biogas will be installed at YLSEPP. The preliminary site layout of the proposed YLSEPP and the location of its biogas related facilities are shown in Appendix 10.1.
10.1.1.3 In accordance with Section 3.4.11 and Appendix I of the EIA Study Brief (ESB-313/2019), a hazard assessment should be conducted to evaluate (i) the biogas risk to existing, committed and planned off-site population due to operation of the organic waste co-digestion facility; and (ii) the potential risk associated with the transport, storage, manufacture and use of chlorine/other non-fuel gas DGs due to the Project.
10.1.1.4 The potential risks from chlorine and other non-fuel gas DGs are associated with the operation of a proposed Reclaimed Water Facility, which is proposed to be located adjoining the northern boundary of the YLSEPP. There will be no chlorine/other no-fuel gas DGs related hazards due to operation of the proposed YLSEPP, as such, the potential risk associated with the transport, storage, manufacture and use of chlorine/other non-fuel gas DGs will not be considered in this assessment.
10.2 Environmental Legislation, Standards and Criteria
10.2.1.1 The requirements and criteria for assessing hazard to life are outlined in Section 3.4.11 of the EIA Study Brief (ESB-313/2019) and Annex 4 of the Technical Memorandum on Environmental Impact Assessment Process (EIAO-TM), respectively. The estimated risk levels due to biogas-related operations were compared with the individual and societal risk criteria set out in the Hong Kong Risk Guidelines (HKRG) to determine the acceptability of the risk levels estimated in this hazard assessment.
Hong Kong Risk Guidelines (HKRG), EIAO-TM
Annex 4
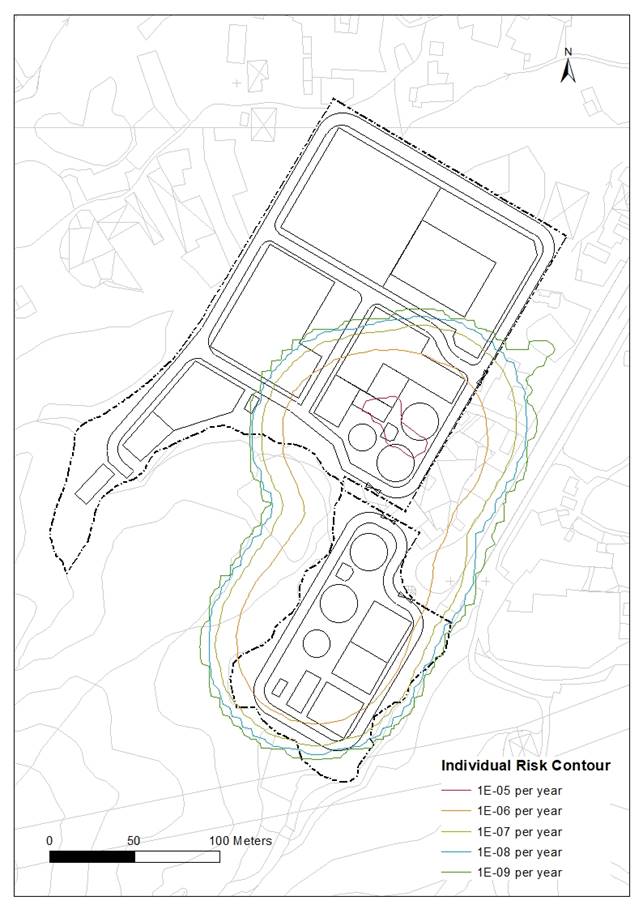
10.2.1.2 Individual risk is the predicted increase in the chance of fatality per year to an individual due to a potential hazard. The individual risk guidelines require that the maximum level of individual risk should not exceed 1 in 100,000 per year i.e. 1×10⁻⁵ per year.
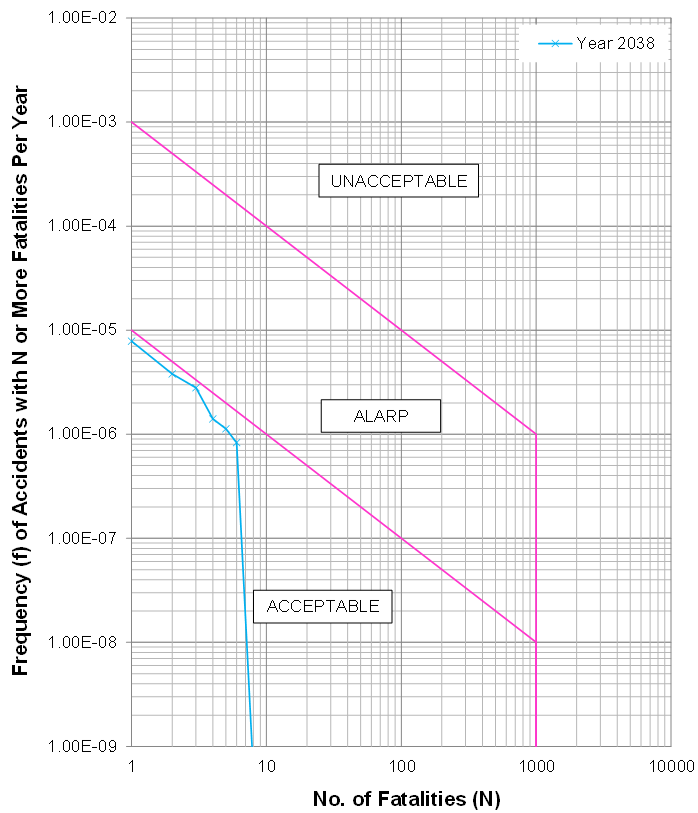
10.2.1.3 Societal risk refers to the risks to the whole population. It is expressed graphically by plotting the cumulative frequency (F) of N or more deaths in the population from incidents at a certain installation against the number of fatalities (N) (Diagram 10.1 refers). Two F-N risk lines are used in the HKRG to denote “Acceptable” or “Unacceptable” societal risks. To avoid major disasters, there is a vertical cut-off line at the 1,000 fatality level extending down to a frequency of 1 in a billion (1x10⁻⁹) per year. The intermediate region indicates that the acceptability of societal risk is borderline and that it should be reduced to a level which is “as low as reasonably practicable” (ALARP). It seeks to ensure that all practicable and cost-effective measures that can reduce risk are considered.
|
|
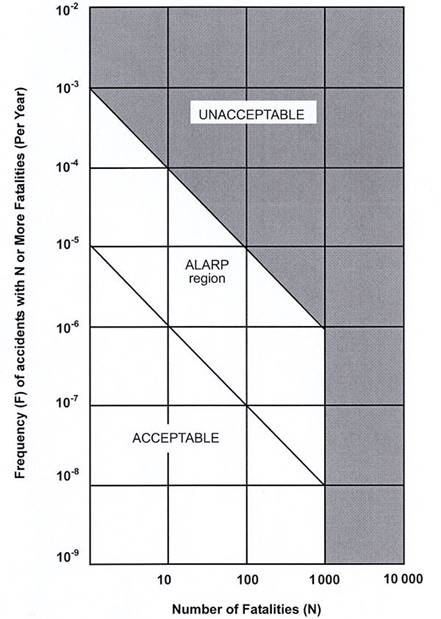
Diagram 10.1 Societal Risk Guidelines for Acceptable Risk Levels
10.3 Study Objectives and Methodology
10.3.1 Study Objectives
10.3.1.1 The main objectives of the hazard assessment, as detailed in Appendix I of the EIA Study Brief, are to:
(i) identify hazardous scenarios associated with the generation, storage, utilization, processing and transmission (if applicable) of biogas due to the Project and then determine a set of relevant scenarios to be included in a QRA;
(ii) execute a QRA of the set of hazardous scenarios determined in sub-section (i) above, expressing population risks in both individual and societal terms;
(iii) compare individual and societal risks with the criteria for evaluating hazard to life stipulated in Annex 4 of the EIAO-TM; and
(iv) identify and assess practicable and cost-effective risk mitigation
measures.
10.3.2 Methodology
10.3.2.1 To ensure that the methodology and approach of this hazard assessment are consistent with those of previous studies with similar issues, the hazard assessments under the approved EIAs for Development of Organic Waste Treatment Facilities (OTWF), Phase 2 (AEIAR-180/2013) [1] and Yuen Long Effluent Polishing Plant (YLEPP) (AEIAR-220/2019) [2] have been reviewed and referenced for this Project.
10.3.2.2 The QRA consists of the following six main tasks:
(i) Data / Information Collection and Update: Relevant data / information necessary for the hazard assessment, including project design and surroundings of the Project were collected;
(ii) Hazard Identification: A set of relevant hazardous scenarios associated with the operations of the organic waste co-digestion facility were identified by reviewing relevant literature and studies with similar installations as well as historical accident database, such as Major Hazard Incident Data Service (MHIDAS);
(iii) Frequency Estimation: Frequencies of each hazardous event leading to fatalities with full justification were estimated by reviewing historical accident data, previous similar projects and using Fault Tree Analysis (FTA) of the identified hazardous scenarios;
(iv) Consequence Analysis: The consequences of the identified hazardous scenarios were analysed by conducting source term modelling and effect modelling.
(v) Risk Integration and Evaluation: The risks associated with the identified hazardous scenarios were evaluated. The evaluated risks were compared with the HKRG in EIAO-TM to determine their acceptability; and
(vi) Identification of Mitigation Measures: Where necessary, practicable and cost-effective risk mitigation measures were identified and assessed to ensure compliance with the ALARP principle in the HKRG. Risks of the mitigated case were re-assessed to determine the level of risk reduction as required.
10.3.2.3 The main tasks of the QRA are shown schematically in Diagram 10.2.
|
|

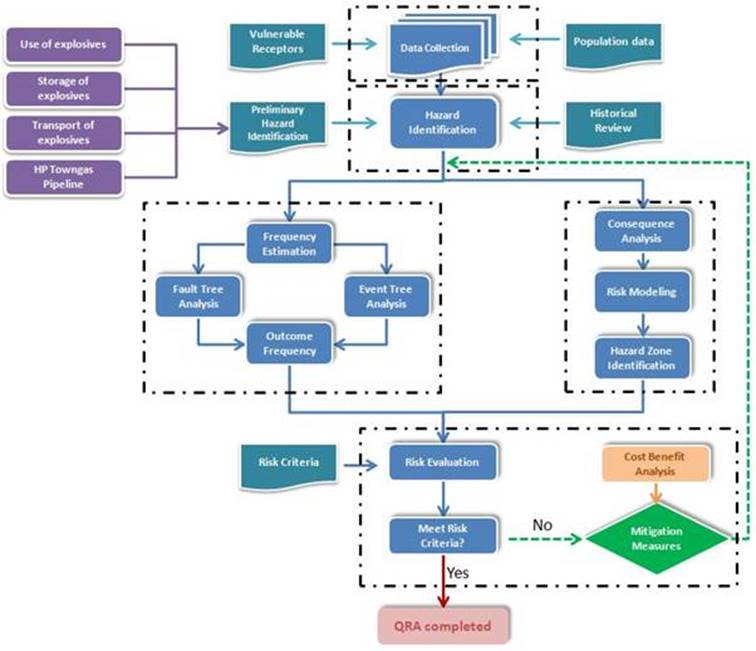
Diagram 10.2 Schematic Diagram of QRA Process
10.3.3 Assessment Year
10.3.3.1 Based on the currently envisaged construction programme, the YLSEPP will be commenced in 2032. However, the Stage 3 works of YLS development is tentatively to be commenced in 2031 and the targeted intake year would be 2038. Year 2038 was proposed as the assessment year for operation of the YLSEPP to take into account population of the YLS development.
10.4 Description of Surroundings
10.4.1.1 Societal risk is a measure of the consequence magnitude and the frequency of the hazardous events. To establish the impact of any release (the number of people likely to be affected) in the future, it is necessary to know the future surrounding population levels. These would include residential population, government and institutional population and transport population but exclude staff of the YLSEPP since they are considered as voluntary risk takers.
10.4.2 On-site Populations
10.4.2.1 The following population is anticipated in YLSEPP during operation phase of the plant:-
(i)
Staff:
the number of staff of YLSEPP would be less than 100, and they are considered
as voluntary risk takers and would not be considered in this assessment.
(ii)
Guided
visitors: people visited the plant with pre-appointment similar to the current
arrangement in other STWs being operated by DSD. The number of visitors
shall be limited to a maximum of 50 per visit. The
visitors should be registered at the Administration Building upon arrival to
YLSEPP and briefed the potential risks before start of the visits. During
the course of visits, the visitor should be accompanied by plant’s staffs who
are familiar with the plant situations and evacuation means.
10.4.3 Surrounding Populations
10.4.3.1 The site of the proposed YLSEPP is located at the southern part of YLS stage 3 development. The proposed organic waste co-digestion facility is located in the southern corner of the proposed YLSEPP. All population groups included in this assessment are detailed in Appendix 10.2.
Land
and Building Population
10.4.3.2 Population covered in the QRA included users of governmental facilities and amenity and also residents of the proposed housings in the YLS Stage 3 development. Estimation of land and building populations was based on the latest information provided by Civil Engineering and Development Department (CEDD) and are summarized in Table 10.1.
Table 10.1 Land and Building Population Considered for Hazard Assessment
|
ID |
Description |
Maximum Population in 2038 |
|
1 |
Proposed Reclaimed Water Facility |
25 |
|
2 |
Reedbed / Flood Retention Pond |
0 |
|
3 |
Site No. A3.3 - Amenity |
0 |
|
4 |
Site No. GB3.1 - Green Belt |
0 |
|
5 |
Site No. OU3.1 - Hillside River
with Scenic Cycle Track (including Reedbed) Note 1 |
103 |
|
6 |
Sie No. DO3.2 - Cycle Park Note
1 |
311 |
|
7 |
Site No. LO3.6 - Local Open
Space Note 1 |
96 |
|
8 |
Site No. R3.1e - Residential |
804 |
|
9 |
Site No. R3.4a - Residential |
1184 |
|
10 |
Site No. R3.4b - Residential |
1333 |
|
11 |
Site No. E3.3 - Primary School |
821 |
|
12 |
Site No. G3.4 - Government
Reserve Note 3 |
0 |
|
13 |
Site No. G3.3 - Government
Reserve |
10 |
|
14 |
Site No. G3.5 - Government
Reserve Note 3 |
0 |
|
15 |
Site No. LO3.7 - Local Open
Space Note 1 |
43 |
|
16 |
Site No. ARG3.1 - Agriculture Note
2 |
10 |
|
17 |
Sie No. DO3.1 - District Open
Space Note 1 |
114 |
|
18 |
Sie No. VR3.1 - Residential |
60 |
|
19 |
Site No. E3.1 - Primary School |
821 |
|
20 |
Site No. LO3.5 - Local Open
Space Note 1 |
34 |
Note 1:
Population was assumed by using density of 0.01 person per m2
Note 2: Population was
assumed based on site survey.
Note 3: The lands were reserved for unmanned
facilities.
10.4.3.3 An average of 5% of the residential and school population was taken to be outdoors; while 50% of the population in the proposed Reclaimed Water Facility and sites reserved for governmental uses was taken to be outdoors.
Traffic
Population
10.4.3.4 The traffic population considered in this assessment included the population travelling in motor vehicles on Pak Sha Shan Road, Kung Um Road and new roads with the YLS development. With reference to the Traffic Impact Assessment for this Project and the Annual Traffic Census from Transport Department [9], the traffic population was estimated based on the following equation:
![]()
10.4.3.5 The traffic population considered in this assessment, which was assumed to be 100% outdoor, is summarized in Table 10.2 and detailed in Appendix 10.2.
Table 10.2 Traffic Population Considered for Hazard Assessment
|
ID |
Description |
Maximum Population in 2038 |
|
|
Daytime |
Night-time |
||
|
R1 |
Pak Sha Shan
Road |
7 |
7 |
|
R2 |
Kung Um Road |
13 |
10 |
|
R3 |
New Road within
YLS Development |
8 |
7 |
Time
Modes
10.4.3.6 With reference to previous similar studies [1][2][5][6], four time modes as detailed in Table 10.3 were applied in this hazard assessment to reflect the temporal distribution of population and to address the variation in levels of activities that could lead to a release and the variation in population in the assessment area with time.
Table 10.3 Time Modes Adopted for Hazard Assessment
|
Day Category |
Time Period |
Time Mode |
|
|
Weekday |
Daytime |
(07:00 to 19:00) |
Weekday (Daytime) |
|
Night |
(19:00 to 07:00) |
Weekday (Night) |
|
|
Weekend |
Daytime |
(07:00 to 19:00) |
Weekend (Daytime) |
|
Night |
(19:00 to 07:00) |
Weekend (Night) |
|
10.4.4 Meteorological Data
10.4.4.1 Meteorological data is required for consequence modelling and risk calculation. Consequence modelling (dispersion modelling) requires wind speed and stability class to determine the degree of turbulent mixing potential whereas risk calculation requires wind-rose frequencies for each combination of wind speed and stability class.
10.4.4.2 Meteorological data were obtained from Lau Fau Shan Weather Station (2015-2019) where wind speed, stability class, weather class and wind direction are available. This data represented the weather conditions for the area and had already taken into account of seasonal variations, and therefore were considered applicable to this assessment.
10.4.4.3 The data were transformed into an array of weather classes that can be expressed in a combination of wind speed and Pasquill stability classes to represent daytime and night-time meteorological conditions in accordance with the Guidelines for Quantitative Risk Assessment: Purple Book [10]. Pasquill stability classes (A to F) represent the atmospheric turbulence with Class A being the most turbulent class while Class F is the least turbulent class. These combinations are considered adequate to reflect the full range of observed variations in these quantities. It is not necessary or efficient to consider every combination observed. The principle is to group these combinations into representative weather classes, which together would cover all conditions observed. Once the weather classes have been selected, frequencies for each wind direction for each weather class can then be determined. These frequency distributions are given in Table 10.4 and Table 10.5 for the daytime and night-time meteorological conditions respectively.
Table 10.4 Daytime Weather Class-Wind Direction Frequencies at Lau Fau Shan Weather Station
|
Wind Direction |
Frequency (%) |
||||||
|
2B |
1D |
3D |
6D |
2E |
1F |
Total |
|
|
0 |
4.55 |
0.33 |
2.7 |
2.31 |
0.28 |
0.25 |
10.42 |
|
30 |
2.09 |
0.18 |
3.76 |
0.96 |
0.72 |
0.09 |
7.8 |
|
60 |
4.47 |
0.3 |
10.75 |
2.36 |
2.74 |
0.29 |
20.91 |
|
90 |
2.35 |
0.3 |
4.03 |
0.97 |
1.38 |
0.43 |
9.46 |
|
120 |
1.35 |
0.19 |
2.55 |
1.29 |
0.83 |
0.51 |
6.72 |
|
150 |
1.33 |
0.11 |
3.07 |
2.2 |
0.8 |
0.21 |
7.72 |
|
180 |
0.98 |
0.06 |
1.81 |
1.11 |
0.26 |
0.12 |
4.34 |
|
210 |
1.06 |
0.07 |
2.02 |
2.51 |
0.41 |
0.14 |
6.21 |
|
240 |
5.77 |
0.07 |
3.31 |
3.29 |
0.37 |
0.11 |
12.92 |
|
270 |
2.43 |
0.17 |
0.71 |
0.29 |
0.12 |
0.07 |
3.79 |
|
300 |
2.05 |
0.07 |
0.41 |
0.41 |
0.06 |
0.07 |
3.07 |
|
330 |
3.51 |
0.12 |
1.33 |
1.47 |
0.11 |
0.1 |
6.64 |
|
All |
31.94 |
1.97 |
36.45 |
19.17 |
8.08 |
2.39 |
100 |
Table 10.5 Night-time Weather Class-Wind Direction Frequencies at Lau Fau Shan Weather Station
|
Wind Direction |
Frequency (%) |
||||
|
4D |
6D |
2E |
1F |
Total |
|
|
0 |
1.34 |
1.75 |
0.67 |
0.97 |
4.73 |
|
30 |
4.49 |
1.41 |
2.69 |
0.78 |
9.37 |
|
60 |
13.96 |
1.07 |
12.39 |
1.59 |
29.01 |
|
90 |
4.34 |
0.59 |
7.19 |
2.28 |
14.4 |
|
120 |
2.99 |
0.73 |
5.46 |
2.86 |
12.04 |
|
150 |
4.22 |
0.7 |
7.45 |
2.16 |
14.53 |
|
180 |
2.15 |
0.41 |
2.46 |
0.96 |
5.98 |
|
210 |
1.17 |
0.46 |
1.78 |
0.87 |
4.28 |
|
240 |
0.34 |
0.06 |
0.67 |
0.61 |
1.68 |
|
270 |
0.15 |
0.06 |
0.18 |
0.25 |
0.64 |
|
300 |
0.28 |
0.2 |
0.15 |
0.18 |
0.81 |
|
330 |
0.99 |
0.84 |
0.44 |
0.26 |
2.53 |
|
All |
36.42 |
8.28 |
41.53 |
13.77 |
100 |
10.5 Hazard Identification
10.5.1 Introduction
10.5.1.1 A hazard is described as the property of a material or activity with the potential to do harm. Potential hazards associated with generation, transfer, storage and use of biogas in the organic waste co-digestion facility within the proposed YLSEPP were identified. All the operation information and parameters have been confirmed with the engineers. This section outlines the hazards preliminarily identified for the facility.
10.5.1.2 Historical incidents and relevant studies of similar facilities were reviewed to identify the possible hazardous scenarios and to ensure that all the relevant hazardous scenarios were incorporated into this assessment.
10.5.2 Facility Description
10.5.2.1 The organic waste co-digestion facility at the proposed YLSEPP will receive approximately 100 wet tonnes / day of pre-treated organic wastes through pipelines or tankers for co-digestion with sewage sludge and handle the associated wastewater and biogas. Proven biological treatment technologies will be adopted to recover reusable energy, i.e. biogas, from source-separated organic wastes and sewage sludge. Biogas generated will be used onsite heat and power production. The location plan of the facility and the treatment process are illustrated in Appendix 10.1.
Digesters
10.5.2.2 Three duty and one standby cylindrical anaerobic sludge digesters, each of which is 19m (Dia.) × 28m (H) (internal dimension) in size, will be provided to handle the pre-treated organic waste and sludge. The biogas volume of each digester is 330m3. The working temperature and pressure of the digesters will be maintained at 35ºC and 1 bar.
10.5.2.3 The digesters consist of concrete, steel or glass enamel holding tanks, with either gas or top mounted mixing systems. Approximately 100 wet tonnes / day of pre-treated organic waste and 70 wet tonnes / day of sewage sludge will enter the digestion tanks along with additional water to reduce the Dissolved Solid (DS) content from an estimated 15% to 5%. The estimated average residence time of the organic waste / sludge within the digesters is assumed to be 20 days. Digested sludge / organic waste will be dewatered for disposal and the wastewater from the dewatered compost will be transferred to the side-stream treatment facilities / inlet works of YLSEPP for treatment.
10.5.2.4 Heating is required for biomass feeding of the digesters and for heat loss compensation from the digesters. The required heating will be provided via heat recovered from the combined heat and power (CHP) unit, or from a boiler.
10.5.2.5 Pressure relief valves will be installed on the digesters to protect against overpressure (50 mbarg). Overflow pipes will be provided on the digesters for protection against overfilling.
Biogas
Holders
10.5.2.6 The biogas generated will be stored in the biogas holders. There will be two cylindrical biogas holders, each of which is 16m (Dia.) × 13.7m (H) in size with a maximum biogas storage of 1,600m3 per tank. The total storage amount of the biogas will be around 3,840 kg. The quantity does not exceed the lower threshold quantity, i.e. 15 tonnes, for Potentially Hazardous Installations (PHIs) for flammable gas and town gas installations in Hong Kong. Therefore, the proposed waste treatment facilities are not classified as a PHI. The biogas storage would be maintained at a temperature 35 ºC and a pressure of 1.03 bar.
10.5.2.7 Dry seal (Wiggins) type biogas holders with steel containment will be used in the proposed facility for evening out variations in biogas production from the digesters. This type of gas holder typically consists of a cylindrical steel shell and a displacement piston, which is allowed to go up and down with the change of volume of gas. The gas tightness is maintained by a seal between the piston and the inside of the shell. There are pressure relief valves on the biogas holder for protection against the exceedance of designed gas storage pressure and overflow pipes for protection against overfilling.
10.5.2.8 A non-return valve will be installed at the inlet pipe to prevent gas from back-flow. Gas is discharged through the outlet pipe by suction blower. There will be emergency shut-off valves at the inlet and outlet pipes of the gas holder. In case of gas holder failure, the emergency shut-off valves can close the inlet and outlet pipes and the release of biogas to the atmosphere can be minimised.
Sulphur
Absorption Vessels
10.5.2.9 The stored biogas will go through the sulphur absorption vessels to remove the hydrogen sulphide (H2S) before passing to the CHP generator to produce electricity and heat for use onsite.
10.5.2.10 Two duty and two standby sulphur absorption vessels, each of which is 3.5m (Dia.) x 3.7m (H) in size, will be provided downstream of the gasholders for the absorption of H2S in the biogas. The working temperature and pressure of the sulphur absorption vessels will be maintained at 35 ºC and 1.03 bar. The absorption vessels are made of steel and filled with zinc oxide or iron oxide as absorbents. An explosion proof blower will be used to extract the biogas from gasholder to the sulphur absorption vessels at 400 mbarg.
Inlet
/ Outlet Piping
10.5.2.11 A total of 100m of aboveground inlet / outlet pipe (150mm Dia.) will be provided to the facility. All other piping will be underground or provided at the basement of concrete buildings. The working temperature and pressure of the inlet and outlet piping will be maintained at 35 ºC and 1.03 bar.
10.5.3 Biogas Properties
10.5.3.1 Biogas is a colourless flammable a combustible mixture of gases at atmospheric conditions that comprises mainly methane (CH4) and CO2. Generally, biogas from anaerobic digestion process has a methane content of 55% to 70% by volume. The exact composition of biogas depends on the substance that is being decomposed. If the material consists of mainly carbohydrates, such as glucose and other simple sugars and high-molecular compounds (polymers) such as cellulose and hemicellulose, the methane production is low. However, if the fat content is high, the methane production is likewise high [3]. In general, the physical properties of biogas are also very similar to those of natural gas. While it is non-toxic, in high concentrations it could lead to asphyxiation. A loss of containment can lead to jet fire (if stored/ transferred under sufficient pressure) or to an explosion if the gas accumulates in a confined space. The properties of biogas from Anaerobic Digestion (AD) process are summarized in Table 10.6 [1][2].
Table 10.6 Composition and Properties of Biogas from Anaerobic Digestion Process
|
Property |
Biogas from Anaerobic Digestion |
|
Methane Content |
55% – 70% |
|
Carbon Dioxide Content |
30% – 45% |
|
Density |
1.2
Kg/Nm3 |
|
Lower Caloric Value |
23 MJ/Nm3 |
|
Flammability# |
Extremely
Flammable |
|
Auto-Ignition Temperature# |
580°C |
|
Flash Points# |
-188°C |
|
Melting Point# |
-182.5°C |
|
Boiling Point# |
-161.4°C |
|
Flammable Limits# |
5%
(Lower) – 15% (Upper) |
|
Vapour Density# |
0.59-0.72
(air = 1) |
Remark:
# Physical
properties of biogas that are similar to natural gas.
10.5.3.2 Given that flammability increases with increase of methane content, and the exact composition of biogas varies with the substance that is being decomposed, it is conservatively assumed that the biogas is 100% methane in the risk model.
10.5.4 Review of Historical Incident Database and Relevant Studies
10.5.4.1 Relevant biogas or methane release scenarios from ORRC and YLEPP (which are facilities of similar nature as the proposed facility at YLSEPP) identified in historical incident databases, such as MHIDAS database, eMARS, FACTS and ARIA, were examined. The recorded hazardous scenarios were mainly associated with leakages from piping, valves and storage vessels and operator error. A total of 11 incidents records related to biogas and methane were identified and these are summarized in Table 10.7 and detailed in Appendix 10.3.
Table 10.7 Summary of Biogas or Methane Incidents
|
Hazardous Scenario |
No. of Cases |
Country |
|
Methane
Storage Tank Failure |
3 |
Turkey,
India, Australia |
|
Methane
Pipeline Failure |
2 |
UK,
USA |
|
Anaerobic
Digestion Plant Failure |
6 |
Italy,
France, Germany, India |
10.5.4.2 The hazardous scenarios of biogas identified in the relevant studies were reviewed and adopted in this hazard assessment where applicable. Failure events and the respective hazardous scenarios associated with the biogas facilities were identified and assessed in the approved EIA studies for OWTF, Phase 2 (AEIAR-180/2013) [1] and YLEPP (AEIAR-220/2019) [2]. The identified hazardous scenarios were mainly associated with leakages from piping, valves and storage vessels due to undetected material defect.
10.5.5 Spontaneous Failures
Digester
Failure
10.5.5.1 Failure of the digesters could be caused by undetected corrosion, fatigue, material or construction defect. Release of biogas could be from various parts of the digesters as well as the associated piping and devices. Possible hazardous outcomes include fireball, jet fire, flash fire and Vapour Cloud Explosion (VCE).
Gasholder
Failure
10.5.5.2 Dry seal (Wiggins) type biogas holders will be used for the proposed facility. A dry seal (Wiggins) type gas holder is different from column guided water-sealed gas holder that do not have a gas holder crown. A seal is installed between the piston and the inside of the shell to maintain gas tightness inside the holder and prevent rotation or side movement of the piston. A levelling system consists of wire ropes and balance weights is equipped to prevent tilting of the piston. The seal and the levelling system will be inspected regularly.
10.5.5.3 Failure of the gas holders could be caused by undetected corrosion, fatigue, material or construction defect. Release of biogas could be from various parts of the gas holders or associated piping and devices. Possible hazardous outcomes include fireball, jet fire, flash fire and VCE.
Sulphur
Absorption Vessel Failure
10.5.5.4 The absorbents used for removal of H2S in the sulphur absorption vessels are neither flammable nor explosive that the major hazard will be from the release of biogas. Failure of sulphur absorption vessels could be caused by undetected corrosion, fatigue, material or construction defect. Release of biogas could be from various parts of the process vessels as well as associated piping and devices. Possible hazardous outcomes include fireball, jet fire, flash fire and VCE.
Aboveground
Inlet or Outlet Piping Failure
10.5.5.5 Piping will be used to connect process vessels to the gasholder, compressor, and further purification unit and CHP. Failure along the on-site piping may be caused by undetected corrosion, fatigue, material or construction defect, or associated with flange gasket / valve leakage resulting in continuous gas release to the atmosphere. Failures of gaskets and valve leak only tend to give relatively small-scale leakage and will not contribute to any off-site risk. Nonetheless, gasket and valve leak failure were considered and included into pipework failure in this hazard assessment with reference to previous similar studies [1][2]. Possible hazardous outcomes from aboveground / underground piping include flash fire and VCE, while jet fire could also result from failure of aboveground piping.
10.5.6 External Hazards
10.5.6.1 External hazards that are outside the control of the operating personnel could still pose a threat to the organic waste co-digestion facility at the proposed YLSEPP. Such hazards are termed as ‘external hazards’ because they are independent of the operations on-site but can lead to major hazard scenarios. This section discusses the credibility of loss of containment due to the external hazards with respect to Hong Kong’s geographical location.
Aircraft
Crash
10.5.6.2 The Project is located around 13 km northeast from the Hong Kong International Airport. The frequency of aircraft crash was estimated using the methodology of the HSE [10] and detailed in Section 10.6.3.
Earthquake
10.5.6.3 In Hong Kong, buildings and infrastructures are designed to withstand earthquakes up to Modified Mercali Intensity (MMI) VII. It was estimated that MMI VIII is required to provide sufficient intensity to result in damage to specially designed structure. It was assumed that failure in earthquake is possible for storage tank rupture, leakage, pipeline rupture and leakage. Details of frequency analysis are given in Section 10.6.3.
Vehicle
Impact
10.5.6.4 Only authorised vehicles will be permitted to enter the proposed YLSEPP, and speed will be restricted for vehicle movements within the site. Safety markings and marked crash barriers will be provided to the above ground piping, digesters and gasholders near the internal road. Vehicle impact could cause only leak failure to digesters and gas holders as well as both rupture failure and leak failure to aboveground piping [1][2]. The accident rate was estimated based on statistical data for Vehicle/ Object Crash accident involving medium and heavy goods vehicles in recent years and detailed in Section 10.6.3.
Landslide
10.5.6.5 The proposed biogas facilities are surrounded by several natural terrains at their southern and western directions. It was conservatively assumed that failure of the aboveground bigas handling facilities including digesters, gas holders, sulphur absorption vessels and pipelines due to natural terrain landslide is possible.
10.5.6.6 In addition, there are two man-made geotechnical features (i.e. 6NW-D/R 16 and 6NW-D/CR 63) located at around 20m away from the eastern boundary of the proposed YLSEPP. These two geotechnical features are located within the YLS development and they will be either demolished or upgraded during the YLS development. As a result, failure of biogas facilities due to the failure of these two man-made features was not further considered in this assessment.
Lightning
10.5.6.7 Lightning sparks could ignite combustible gas in air. The proposed YLSEPP will be equipped with a lightning protection system that can effectively protect the equipment, include the organic waste co-digestion facility, from lightning. Lightning protection installations should be installed following IEC 62305, BS EN 62305, AS/NZS 1768, NFPA 780 or equivalent standards [15]. The installations will be protected with lightning conductors to safely earth direct lightning strikes. The double grounding system will be inspected regularly. Therefore, failures due to lightning strikes are to be covered by generic failure frequencies [1][2].
External
Fire
10.5.6.8 External fire means the occurrence of fire event which leads to the failure of the equipment inside the organic waste co-digestion facility. In the proposed YLSEPP, the facilities will be equipped with fire alarm and fire suppression system. In addition, stringent procedures will be implemented to prohibit smoking or naked flames to be used on-site to further lower the probability of initiation due to external fire.
10.5.6.9 However, hill / vegetation fires are relatively common in Hong Kong and could potentially occur near YLSEPP. Details of frequency analysis are given in Section 10.6.3.
Typhoon/
Tsunami
10.5.6.10 Loss of containment due to severe environmental event such as typhoon or tsunami (large scale tidal wave) is not possible as the proposed YLSEPP is designed to withstand wind load for local typhoon while Hong Kong is not threatened by tsunami. Subsidence is usually slow in movement and such movement can be observed and remedial action can be taken in time. Thus, typhoon or tsunami causing a release of biogas was not considered further in this assessment.
10.5.7 Possible Hazardous Scenarios Considered
10.5.7.1 The organic waste co-digestion facility at the proposed YLSEPP will be using organic waste treatment technology, similar to that in the operation of the OWTF Phase 2 and YLEPP, i.e. anaerobic digestion of the organic waste. The sulphur absorption vessels would be structurally similar to anaerobic digestion vessels. Possible hazardous scenarios of the facility are listed in Table 10.8.
Table 10.8 Possible Hazardous Scenarios and Hazardous Outcomes of the Organic Waste Co-digestion Facility at YLSEPP
|
Potential
Sources |
Release
Type |
Hazardous
Outcome |
|
Gasholder |
Rupture |
Fireball; VCE; and Flash fire |
|
Leak |
Jet fire; VCE; and Flash fire |
|
|
Digester |
Rupture |
Fireball; VCE; and Flash fire |
|
Leak |
Jet fire; VCE; and Flash fire |
|
|
Sulphur Absorption Vessel |
Rupture |
Fireball; VCE; and Flash fire |
|
Leak |
Jet fire; VCE; and Flash fire |
|
|
Aboveground inlet or outlet piping / pump /
non-return valve / flange |
Rupture / Leak |
Jet fire; VCE; and Flash fire |
10.5.7.2 Hazardous outcomes were assessed using PhastRisk 6.7, to determine the risk impact, where the potential risk associated with the operation, layout and facilities threat posed to life and neighbouring property in a hazardous outcome at the Project.
10.6 Frequency Analysis
10.6.1 Introduction
10.6.1.1 Frequencies for each of the identified hazardous scenarios were estimated using the best available failure data or historical accident data in the process and gas industry or failure frequencies of similar installations or events. The frequencies documented in the relevant sources were reviewed and justified as necessary to reflect the specific operation and risk reduction practices evident at the organic waste co-digestion facility.
10.6.2 Spontaneous Failures Frequencies
Digester
/ Gasholder / Sulphur Absorption Vessel Failure
10.6.2.1 According to Guidelines for Quantitative Risk Assessment: Purple Book, the catastrophic rupture and leak failure frequencies of digester tank / gasholder / sulphur absorption vessel are 1×10⁻⁵ per year and 1×10⁻⁴ per year respectively [10].
Aboveground
Piping Failure
10.6.2.2 According to Guidelines for Quantitative Risk Assessment: Purple Book, catastrophic rupture and leak failure frequencies of aboveground piping are 3×10⁻⁷ per metre per year (150 mm dia.) and 2×10⁻⁶ per metre per year (150 mm dia.) respectively [10].
10.6.2.3 A summary of the base event frequencies is shown in Table 10.9.
Table 10.9 Summary of Spontaneous Failures Frequencies
|
Events |
Frequency of Occurrence |
|
|
Rupture / Catastrophic Failure |
Leak / Partial Failure |
|
|
Digester |
1.00×10⁻⁵ per year |
1.00×10⁻⁴ per year |
|
Gasholder |
1.00×10⁻⁵ per year |
1.00×10⁻⁴ per year |
|
Sulphur Absorption Vessel |
1.00×10⁻⁵ per year |
1.00×10⁻⁴ per year |
|
Aboveground Inlet or Outlet Piping |
3.00×10⁻⁷ per metre per year |
2.00×10⁻⁶ per metre per year |
10.6.3 External Event Frequencies
Aircraft
Crash
10.6.3.1 The model takes into account specific factors such as the target area of the proposed hazard site and its longitudinal (x) and perpendicular (y) distances from the runway threshold (Diagram 10.3 refers).
|
|
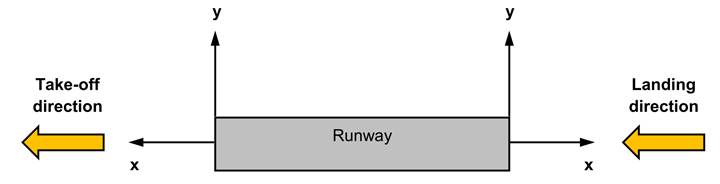
Diagram 10.3 Aircraft Crash Coordinate System
10.6.3.2 The crash frequency per unit ground area (per km2) is calculated as:
![]() (1)
(1)
where N is
the number of runway movements per year and R is the probability of an
accident per movement (landing or take-off). F(x,y) gives
the spatial distribution of crashes and is given by:
Landings
![]() (2)
(2)
for ![]() .
.
Take-off
![]() (3)
(3)
for ![]() .
.
10.6.3.3 Equations (2) and (3) are valid only for the specified range of x values. If x lies outside this range, the impact probability is zero. This case applies for 07L and 07R runways for arrival and 25L and 25R runways for departure flight path.
10.6.3.4 The probability of an accident per movement R is interpreted from NTSB data for fatal accidents in the U.S. involving scheduled airline flights during the period 1986 – 2010. The 10-year moving average suggested a downward trend with recent years showing a rate of about 2×10⁻⁷ per flight. There were only 13.5% of accidents associated with the approach to landing, 15.8% associated with take-off and 4.2% were related to the climb phase of the flight [17]. The frequency for the approach of landings was therefore taken as 2.7×10⁻⁸ per flight and for take-off was 4.0×10⁻⁸ per flight.
10.6.3.5 The number of runway movement of aircraft N was provided by yearly statistics of the Hong Kong International Airport (HKIA), and the figures in the latest 10 years are presented in Table 10.10 [18]. Due to the social unrest since mid-2019 and the outbreak of COVID-19, the number of runway movement in 2019 and 2020 was considered to be not representative, as such, the number of movements in 2038 was estimated by linear regression of the data from 2011 to 2018.
10.6.3.6 The movement numbers for both landing and take-off adopted in the calculation were divided by 4 to take into account that only a quarter of landing or take-off use a specific runway.
Table 10.10 Hong Kong International Airport Civil International Air Transport Movements of Aircraft
|
Year |
Landing |
Take-off |
Total |
|
2011 |
166,919
|
166,887
|
333,806
|
|
2012 |
175,861
|
175,823
|
351,684
|
|
2013 |
186,048
|
186,032
|
372,080
|
|
2014 |
195,520
|
195,488
|
391,008
|
|
2015 |
203,043
|
203,005
|
406,048
|
|
2016 |
205,793
|
205,773
|
411,566
|
|
2017 |
210,339
|
210,320
|
420,659
|
|
2018 |
213,899
|
213,867
|
427,766
|
|
2019
[1] |
209,904
|
209,891
|
419,795
|
|
2020
[1] |
80,330
|
80,336
|
160,666
|
|
2038 |
434,442# |
434,429# |
822,998# |
Note:
[1] The
data for 2019 and 2020 were not used to calculate the annual growth rate for
linear regression due to the social unrest since mid-2019 and the outbreak of
COVID-19.
#: based
on an annual growth rate of +3.6% between 2011 and 2018 estimated by linear
regression.
10.6.3.7 Only the aircraft arriving from north-east using either 25R or 25L arrival flight path as well as the aircraft departing towards northeast using either 07R or 07L departure flight path would have potential impact to the proposed YLEPP.
10.6.3.8 For the aircraft arriving from south-west using either 07R or 07L arrival flight path, the longitudinal distance from the runway is around -12km, which is much smaller than -3.275km and thus the potential impact is considered to be zero. Likewise, for the aircraft departing towards south-west using either 25R or 25L departure flight path, the longitudinal distance from the runway is around -12km, which is much smaller than -0.6km and thus the potential impact is considered to be zero.
10.6.3.9 The aircraft crash frequency was obtained by multiplying g(x,y) to the target area which was estimated to be 4.6×10⁻² km2 as tabulated in Table 10.11. The total crash frequency was calculated to be 9.8×10⁻¹⁰ per year.
Table 10.11 Calculation for Aircraft Crash Frequency
|
Year |
Runway |
x (km) |
y (km) |
F(x,y) |
N (per year) |
R (per flight) |
Crash frequency (per unit area) |
Target area (km2) |
Crash Frequency (per year) |
|
2038 |
25R Landing |
8.4 |
9.9 |
3.9E-06 |
108610 |
2.7E-08 |
1.1E-08 |
4.60E-02 |
5.2E-10 |
|
2038 |
25L Landing |
7.9 |
11.5 |
3.4E-06 |
108610 |
2.7E-08 |
1.0E-08 |
4.60E-02 |
4.6E-10 |
|
2038 |
07R Landing |
-12.4 |
13.0 |
0 |
108610 |
2.7E-08 |
0.0E+00 |
4.60E-02 |
0.0E+00 |
|
2038 |
07 L Landing |
-12.6 |
11.4 |
0 |
108610 |
2.7E-08 |
0.0E+00 |
4.60E-02 |
0.0E+00 |
|
2038 |
07L Take-off |
8.4 |
9.9 |
1.4E-08 |
108607 |
4.0E-08 |
5.9E-11 |
4.60E-02 |
2.7E-12 |
|
2038 |
07R Take-off |
7.9 |
11.5 |
3.7E-09 |
108607 |
4.0E-08 |
1.6E-11 |
4.60E-02 |
7.3E-13 |
|
2038 |
25L Take-off |
-12.4 |
13.0 |
0 |
108607 |
4.0E-08 |
0.0E+00 |
4.60E-02 |
0.0E+00 |
|
2038 |
25R Take-off |
-12.6 |
11.4 |
0 |
108607 |
4.0E-08 |
0.0E+00 |
4.60E-02 |
0.0E+00 |
Earthquake
10.6.3.10 As Hong Kong is situated in a region of low seismicity [12][13] and located rather far away from Circum-Pacific Seismic Belt that runs through Japan, Taiwan and the Philippines [14], the probability of earthquake occurrence at MMI VIII and higher is very low comparing with other places and is estimated to be 1.0×10⁻⁵ per year [1]. It was assumed that failure in earthquake was possible for storage tank rupture, leakage, pipeline rupture and leakage and the probability of failure in earthquake was assumed to be 0.01 [1][11].
Vehicle
Impact