3
Air
Quality Impact
This section presents the assessment on potential air quality impacts arising from construction and operation of the Project, which has been conducted in accordance with the criteria and guidelines as stated in Section 1 of Annex 4 and Annex 12 of the Technical Memorandum on Environmental Impact Assessment Process (EIAO-TM) as well as the requirements given in the EIA Study Brief (No. ESB-365/2024).
The criteria for evaluating air quality impacts and the guidelines for air quality assessment are laid out in Annex 4 and Annex 12 of the EIAO-TM.
3.2.1 Air Pollution Control Ordinance (Cap. 311)
The principal legislation for the management of air quality in Hong Kong is the Air Pollution Control Ordinance (APCO) (Cap. 311). As specified in Schedule 1 of the Air Pollution Control Ordinance (APCO) (Cap. 311), incinerators with installed capacity exceeding 0.5 tonne per hour and which are used for the destruction by burning of wastes or refuse, as well as mineral works in which the processing capacity exceeds 5 000 tonnes per annum and in which minerals are subjected to any size reduction, grading or heating by a process giving rise to dust, are classified as specified processes. Any person who wants to conduct the specified process is required to obtain a licence from EPD. The owner of any premises used for the conduct of any specified process shall use the best practicable means for preventing the emission of noxious or offensive emissions from such premises, and for preventing the discharge, whether directly or indirectly, of such emissions into the atmosphere, and for rendering such emissions where discharged harmless and inoffensive.
3.2.2 Air Quality Objectives
The Air Quality Objectives (AQOs) given under the APCO stipulate the statutory ambient limits for air pollutants and the maximum allowable number of exceedances over specific averaging periods. The prevailing AQOs., which has been in effect from 1 January 2022, are presented in Table 3-1. The new AQOs (with a view to implementing in 2025 tentatively), as shown in Table 3-2, will be considered as the benchmark for conducting air quality impact assessment of this EIA study. The prevailing AQOs, at the time of this assessment, were adopted to determine the Significant Impact Levels (SILs) in the Area of Influence (AOI) analysis.
Table 3‑1 Prevailing Hong Kong Air Quality Objectives
|
Pollutants |
Averaging Time |
Concentration Limit (mg/m3) [1] |
Number of Exceedance Allowed per Year |
|
Sulphur
Dioxide |
10-min |
500 |
3 |
|
24-hour |
50 |
3 |
|
|
Respirable
Suspended Particulates |
24-hour |
100 |
9 |
|
Annual |
50 |
N/A |
|
|
Fine
Suspended Particulates |
24-hour |
50 |
18[4] |
|
Annual |
25 |
N/A |
|
|
Nitrogen Dioxide (NO2) |
1-hour |
200 |
18 |
|
Annual |
40 |
N/A |
|
|
Ozone (O3) |
8-hour |
160 |
9 |
|
Carbon Monoxide (CO) |
1-hour |
30,000 |
0 |
|
8-hour |
10,000 |
0 |
|
|
Lead (Pb) |
Annual |
0.5 |
NA |
Notes:
[1] The concentrations of gaseous air pollutants are measured at 293K and 101.325 kPa.
[2] Suspended particles in air with a nominal aerodynamic diameter of 10 μm or less.
[3] Suspended particles in air with a nominal aerodynamic diameter of 2.5 μm or less.
[4] The number of exceedances allowed per year for 24-hour averaged FSP should be 18 days per calendar year for government projects.
Table 3‑2 Proposed Hong Kong Air Quality Objectives with a view to implementing in 2025 tentatively
|
Pollutants |
Averaging Time |
Concentration Limit (mg/m3) [1] |
Number of Exceedance Allowed per Year |
|
Sulphur
Dioxide |
10-min |
500 |
3 |
|
24-hour |
40 |
3 |
|
|
Respirable Suspended
Particulates |
24-hour |
75 |
9 |
|
Annual |
30 |
N/A |
|
|
Fine
Suspended Particulates |
24-hour |
37.5 |
18 |
|
Annual |
15 |
N/A |
|
|
Nitrogen Dioxide (NO2) |
1-hour |
200 |
18 |
|
24-hour [4] |
120 |
9 |
|
|
Annual |
40 |
N/A |
|
|
Ozone (O3) |
8-hour |
160 |
9 |
|
Peak season [4] |
100 |
N/A |
|
|
Carbon Monoxide (CO) |
1-hour |
30,000 |
0 |
|
8-hour |
10,000 |
0 |
|
|
24-hour [4] |
4,000 |
0 |
|
|
Lead (Pb) |
Annual |
0.5 |
NA |
Notes:
[1] The concentrations of gaseous air pollutants are measured at 293K and 101.325 kPa.
[2] Suspended particles in air with a nominal aerodynamic diameter of 10 μm or less.
[3] Suspended particles in air with a nominal aerodynamic diameter of 2.5 μm or less.
[4] 24-hour level
for NO2, peak season level for O3 and 24-hour level for
CO are new parameters in WHO AQGs as well as
HKAQOs.
3.2.3 Technical Memorandum on EIA
Process
Annex 4 of the EIAO-TM has also stipulated that the odour level at an ASR should not exceed 5 odour units based on an averaging time of 5 seconds for odour prediction assessment.
3.2.4 Standards for Non-AQO
Criteria Pollutants
Aside from the AQO criteria pollutants mentioned in Section 3.2.2, Ammonia (NH3) (one of the possible reducing agents to be used in the Selective Catalytic Reduction (SCR) process for reducing NOx emission), Gaseous and vaporous organic substances, Hydrogen Chloride (HCl), Hydrogen Fluoride (HF), Cadmium (Cd), Thallium (Tl), Heavy Metal (including Antimony (Sb), Arsenic (As), Lead (Pb), Chromium (Cr), Cobalt (Co), Copper (Cu), Manganese (Mn), Mercury (Hg), Nickel (Ni) and Vanadium (V)) and Dioxins & Furans, etc. would also be key pollutants emitted from the incinerator. In accordance with Annex 4 of EIAO-TM, for air pollutants with no established criteria under the Air Pollution Control Ordinance nor in the EIAO-TM, standards or criteria adopted by recognized international organizations shall be met. These air pollutants will be assessed in the Health Impact Chapter.
3.2.5 Air Pollution Control (Construction Dust) Regulation
Notifiable and regulatory works are under the control of Air Pollution Control (Construction Dust) Regulation. This Project is expected to include notifiable works (foundation and superstructure construction and demolition) and regulatory works (dusty material handling and excavation). Contractors are required to inform Environmental Protection Department (EPD) and adopt dust reduction measures to minimize dust emission, while carrying out construction works, to the acceptable level.
3.2.6 Air Pollution Control (Non-road Mobile Machinery) (Emission)
Regulation
Under the Air Pollution Control (Non-road Mobile Machinery) (Emission) Regulation, only approved or exempted non-road mobile machineries with a proper label are allowed to be used in the construction site. The contractors are required to ensure the adopted non-road mobile machinery under the Project could meet the prescribed emission standards and requirement.
3.2.7 Air Pollution Control (Fuel Restriction) Regulation
Under the Air Pollution Control (Fuel Restriction) Regulation, types of fuel allowed for use and the sulphur contents in commercial and industrial processes are controlled to reduce sulphur dioxide (SO2) emissions. The contractors are required to use only fuels which are complied with the respective requirements such as gaseous fuel, conventional solid fuel with a sulphur content not exceeding 1% by weight, and liquid fuel with a sulphur content not exceeding 0.005% by weight and a viscosity not more than 6 centistokes at 40oC (i.e. Ultra Low Sulphur Diesel (ULSD)).
3.2.8 Recommended Pollution Control Clauses for Construction
Contracts
The Recommended Pollution Control Clauses (RPCC) are a set of good engineering practice to minimize environmental nuisance to nearby residents and sensitive receivers. Relevant requirements of the RPCC should be included in the works contract for the contractor to follow with a view to reducing the environmental impacts arising from the construction works.
3.2.9 DEVB’s TC No.13/2020, Timely Application of Temporary
Electricity and Water Supply for Public Works Contracts and Wider Use of
Electric Vehicles in Public Works Contracts
This Circular promulgates the policy on timely application of temporary electricity and water supply as well as wider use of electric vehicles (EVs) in public works contracts. Timely provision of electricity and adoption of EVs can help improve roadside air quality and reduce carbon emissions, while timely provision of water supply could not only improve personal hygiene but also reduce pollution. The administrative requirements as set out in this Circular should be followed.
3.2.10 DEVB’s TC No.1/2015,
Emissions Control of NRMM in Capital Works Contracts of Public Works
In addition to the statutory requirements of the Air Pollution Control (Non-road Mobile Machinery) (Emission) Regulation, this Circular promulgates the requirements for the use of non-road mobile machinery (“NRMM”) approved under the regulation in new capital work contracts of public works including design and build contracts. The administrative requirements as set out in this Circular should be followed.
The assessment area for air quality impact shall be defined by a distance of 500 m from the Project boundary and the works of the Project, which shall be extended to include major existing, committed and planned air pollutant emission sources. The assessment area shall be further extended to be agreed by the Director to cover the affected zone of air pollution impact due to stack emissions of the Project, which depends on the chimney height and air pollutant emission rates as specified in the Environmental Impact Assessment (EIA) Study Brief.
The assessment area was defined based on the Areas of Influence (AoIs) identified by evaluation of the emission impact of representative air pollutants from the chimney of the Project against the Significant Impact Levels (SILs).
3.3.1 Identification of Areas of Influence
A screening analysis was conducted to identify the AoIs. PATH v3.0 model was used to predict the project-induced impact from the chimney of the I∙PARK2. A significant impact level (SIL) approach was adopted to identify the areas (i.e. PATH grid and level) which had exceedance of the SIL by comparing the “With Project” and “Without Project” scenarios.
NOx is a major pollutant from combustion and would be converted to NO2 in the presence of O3 and VOC. NO2 is considered to be a potential key air pollutant associated with the operation of the I∙PARK2 chimney due to incineration and will be able to reflect the potential project impact due to the chimney in the AoI analysis. Apart from NO2, the impact of RSP, FSP and SO2 arising from the operation of the I∙PARK2 chimney were also assessed and reviewed against the respective SILs in the AOI analysis.
Two sets of PATH models were conducted, namely Baseline Scenario and “With Project” scenario. The baseline scenario simulated the future air quality condition without Project contribution from the I∙PARK2 chimney, while the “With Project” scenario serves to identify the AoIs for assessment of long-term and short-term impacts from the I∙PARK2 chimney. For the “With Project” scenario, the target hourly NOx emission level of 60mg/Nm3 proposed for the incinerator of I∙PARK2 was adopted in the model run in order to predict the long-term and short-term impacts for NO2. The target daily RSP, FSP, and hourly SO2 emission levels as presented in Appendix 3C were adopted in the model run to predict the long-term and short-term impacts for RSP, FSP, and SO2, respectively.
The significant impact levels of 3.5% AQO limit for hourly NO2, daily FSP and RSP, and daily and 10-minute SO2 criteria and 1% AQO limit for annual NO2, FSP and RSP criteria were made reference to Guidance Note on Specified Process Licence Applications and Assessment of the Resulting Air Quality. The same SILs are applied for all air pollutant parameters in Guidance Note on SPL Applications and Assessment of the Resulting Air Quality and the SILs were based on the prevailing AQOs. If the increases in predicted maximum hourly and annual NO2, maximum daily and annual RSP and FSP, and maximum 10-minute and daily SO2 concentrations contributed from the chimney emission of the Project is greater than the respective SIL at a particular PATH grid and level where air sensitive receivers (ASR) are identified, then the grid would be considered as an AoI.
The AOI analysis result is presented in Appendix 3A. The AoIs cover grids (12,42), (12,43), (13,41), (13,42), (13,43), (14,41), (14,42), (14,44), (15,44), (15,45), (16,44), (16,45), (17,45), (17,46) and (18,47). The identified AoIs for the assessment is presented in Figure 3.1. The predicted increase in NO2, RSP, FSP and SO2 concentrations due to the Project and percentage of project contribution based on the baseline scenario are presented in Appendix 3A.
The cumulative air quality impact assessment including contributions from Tier 1, 2 and 3 emission sources was then carried out for the representative ASRs identified within AoIs and 500 m assessment area. The corresponding results of the Tier 1, 2 and 3 impact assessment at each representative ASRs are presented in Section 3.9.2.
The representative ASRs within AoIs and the 500 m assessment area have been identified in accordance with Annex 12 of EIAO-TM and are summarized in Table 3-3 and shown in Figure 3.1 to 3.7. The details of the ASRs are shown in Appendix 3B.
Table 3‑3 Details of Representative ASRs
|
ASR ID |
Description |
Use |
Assessment Height (mAG) |
No. of Storeys |
Approximate Distance to Project Boundary (m) |
Corresponding PATH Grid |
|
TPO1 |
Fresh Air Intake at 8/F, T-PARK Office |
G/IC |
39 [2] |
1 |
236 |
15,44 |
|
TPO2 |
Fresh Air Intake at 9/F, T-PARK Office |
G/IC |
42 [2] |
1 |
204 |
15,44 (level 3) |
|
WXO1 |
WENTX Office [3] |
G/IC |
1.5 |
1 |
125 |
15,44 (level 1) |
|
TTC1 |
Office, Tsang Tsui Columbarium |
G/IC |
4 [4] |
1 |
32 |
14,44 (level 1) |
|
BPS1 |
GBG Management Building, Black Point Power Station |
Industrial |
1.5, 5, 10 |
3 |
1010 |
13,43 (level 1) |
|
LKT1 |
Lau Ancestral, Lung Kwu Sheung Tan |
Place of Worship |
1.5 |
1 |
1956 |
14,42 (level 1) |
|
LKT2 |
Hai Grove House 2, 24 Pak Long |
Residential |
1.5, 5, 10 |
3 |
3108 |
14,41 |
|
SPN1 |
295 Sheung Pak Nai |
Residential |
1.5 |
1 |
3311 |
17,46 |
|
HPN1 |
2A Ha Pak Nai |
Residential |
1.5 |
1 |
3024 |
17,46 |
|
HPN2 |
Ha Pak Nai Village House |
Residential |
1.5 |
1 |
2970 |
17,46 |
|
HPN3 |
21 Ha Pak Nai |
Residential |
1.5 |
1 |
2676 |
17,46 |
|
NWR1 |
Residential |
1.5 |
1 |
1883 |
17,45 (level 1) |
|
|
HPN4 |
West Ha Pak Nai |
Residential |
1.5 |
1 |
2185 |
17,45 (level 1) |
|
HPN5 |
West Ha Pak Nai |
Residential |
1.5 |
1 |
1596 |
16,45 (level 1) |
|
HPN6 |
West Ha Pak Nai |
Residential |
1.5 |
1 |
1641 |
16,45 (level 1) |
|
HPN7 |
West Ha Pak Nai |
Residential |
1.5 |
1 |
1548 |
16,44 (level 1) |
|
NWR2 |
Village House along Nim Wan Road |
Residential |
1.5 |
1 |
4239 |
18,47 (level 1) |
|
NWR3 |
Village House along Nim Wan Road |
Residential |
1.5 |
1 |
4324 |
18,47 (level 1) |
|
NWR4 |
Village House along Nim Wan Road |
Residential |
1.5 |
1 |
4556 |
18,47 (level 1) |
Note:
[1] Representative ASRs identified within AoIs and 500 m assessment area were considered in the AQIA.
[2] Central air conditioning is provided, and the fresh air intakes are located at 39m and 42m above ground.
[3] According to the approved WENTX VEP, Y-PARK will be replaced by WENTX office during the construction and operation phase of WENTX, therefore, the Y-PARK office would not be considered as ASR under this study. Central air conditioning is provided for WENTX office.
[4] Central air conditioning is provided for the office of Tsang Tsui Columbarium, and the fresh air intake is located at 4m above ground.
[5] As presented in Appendix 3A, the area within the tentative reclamation extent of Lung Kwu Tan Reclamation project has been identified as AoIs considering its potential future uses. Since the Lung Kwu Tan Reclamation and the Re-planning of Tuen Mun West Area project is still under study / planning, no detailed information is available for identifying representative ASRs for assessment at the time of the I∙PARK2 EIA study. The potential cumulative impact would be considered by CEDD in the future EIA study for the top-side development at Lung Kwu Tan. Nevertheless, the area has been covered by the contour map in this EIA study for reference.
[6] As confirmed with the project proponent of WENTX, there is no confirmed land use for the future restored WENT Landfill and its extension at the time of the I∙Park2 EIA study.
Pollution contours for each AoI and 500 m assessment area were produced to present the concentration of the pollutants within each AoI and 500 m assessment area. The representative ASRs within the AoIs to be included in the cumulative impact assessment depend on the PATH model result and whether there are any air sensitive uses within the AOIs.
Existing air quality in the Study Area is affected by the ambient background and nearby emission sources including Black Point Power Station to the south-west, WENT Landfill to the south-east, T∙PARK to the east, and existing traffic from local roads, as well as air quality and odour emission from exposed area of WENT Landfill.
Data collected by EPD’s air quality monitoring station during year 2019 to 2023 were examined and presented in Table 3-4.
Table 3‑4 5-year Ambient Concentration of Air Pollutants recorded at Tuen Mun Air Quality Monitoring Station by EPD for the Period of 2019-2023
|
Air Pollutant |
Averaging Time |
AQO [1] |
Data Description |
Unit |
Year [2][3] |
5-year mean |
||||
|
2019 |
2020 |
2021 |
2022 |
2023 |
||||||
|
Fine Suspended Particulates (FSP) (PM2.5) |
24-hour |
50 (18) |
19th Max. |
μg m-3 |
46 |
41 |
42 |
39 |
38 |
40 |
|
No. of Exceedance(s) |
- |
14 |
7 |
7 |
1 |
1 |
6 |
|||
|
Annual |
25 |
- |
μg m-3 |
24 |
20 |
19 |
18 |
19 |
20 |
|
|
Respirable Suspended Particulates (RSP) (PM10) |
24-hour |
100 (9) |
10th Max. |
μg m-3 |
89 |
84 |
87 |
65 |
76 |
80 |
|
No. of Exceedance(s) |
- |
4 |
1 |
4 |
0 |
1 |
2 |
|||
|
Annual |
50 |
- |
μg m-3 |
41 |
34 |
36 |
32 |
34 |
35 |
|
|
Sulphur Dioxide (SO2) |
10-minute |
500 (3) |
4th Max. |
μg m-3 |
45 |
98 |
22 |
29 |
23 |
43 |
|
24-hour |
50 (3) |
4th Max. |
μg m-3 |
12 |
10 |
9 |
11 |
7 |
10 |
|
|
Nitrogen Dioxide (NO2) |
1-hour |
200 (18) |
19th Max. |
μg m-3 |
166 |
166 |
172 |
128 |
160 |
158 |
|
No. of Exceedance(s) |
- |
2 |
5 |
6 |
0 |
4 |
3 |
|||
|
Annual |
40 |
- |
μg m-3 |
47 |
40 |
44 |
39 |
40 |
42 |
|
|
Carbon Monoxide (CO) |
1-hour |
30,000 |
Max. |
μg m-3 |
2050 |
1650 |
1720 |
1480 |
1370 |
1654 |
|
8-hour |
10,000 |
Max. |
μg m-3 |
1758 |
1513 |
1450 |
1345 |
1143 |
1442 |
|
|
Ozone (O3) |
8-hour |
160 (9) |
10th Max. |
μg m-3 |
203 |
166 |
161 |
195 |
155 |
176 |
|
No. of Exceedance(s) |
- |
25 |
10 |
10 |
23 |
8 |
15 |
|||
Notes:
[1] Values
in ( ) indicate the number of exceedances allowed per year
[2]
Data extracted from EPD Website (http://www.aqhi.gov.hk/)
[3]
Shaded values indicate non-compliance against the prevailing AQOs.
All measured 19th highest 1-hour NO2 levels from 2019 to 2023 complied with the AQO of 200 μg/m3. The measured annual mean levels were within the AQO of 40 μg/m3 in years 2020, 2022 and 2023. The 10th highest daily RSP levels from 2019 to 2023 complied with the AQO of 100 μg/m3. The annual RSP levels were all within the AQO of 50 μg/m3. The 19th highest daily FSP levels had decreased from 46 μg/m3 in 2019 to 38 μg/m3 in 2023, as compared with the AQO of 50 μg/m3. The annual FSP levels were all within the AQO of 25 μg/m3. All the measured 4th highest 10-minute and 4th highest 24-hour SO2 levels were well within their respective AQOs of 500 μg/m3 and 50 μg/m3. The 10th highest 8-hour O3 levels ranged from 155 to 203 μg/m3. The highest 1-hour and 8-hour CO levels were all within the AQO.
The future year background concentrations are made reference to the EPD’s PATH v3.0 modelling results. Since it is targeted for the Project to be commissioned in year 2030, the concentration extracted from Year 2030 PATH results are presented in Table 3-5.
Table 3‑5 Background Concentrations extracted from Year 2030 PATH v3.0 Model
|
Air Pollutant |
Averaging Time |
AQO [1] |
Data Description |
Unit |
|
Grids [2] |
|||||||||||||
|
12,42 |
12,43 |
13,41 |
13,42 |
13,43 |
14,41 |
14,42 |
14,44 |
15,44 |
15,45 |
16,44 |
16,45 |
17,45 |
17,46 |
18,47 |
|||||
|
Fine Suspended Particulates (FSP) (PM2.5) |
24-hour |
50 (18) |
19th Max. |
μg m-3 |
29 |
29 |
29 |
29 |
29 |
29 |
30 |
29 |
32 |
30 |
32 |
31 |
33 |
31 |
31 |
|
Annual |
25 |
- |
μg m-3 |
12 |
12 |
12 |
12 |
12 |
12 |
12 |
12 |
13 |
12 |
13 |
12 |
13 |
12 |
12 |
|
|
Respirable Suspended Particulates (RSP) (PM10) |
24-hour |
100 (9) |
10th Max. |
μg m-3 |
52 |
51 |
51 |
51 |
51 |
51 |
51 |
51 |
54 |
52 |
53 |
52 |
54 |
52 |
53 |
|
Annual |
50 |
- |
μg m-3 |
20 |
20 |
19 |
19 |
19 |
19 |
19 |
20 |
21 |
20 |
20 |
20 |
20 |
20 |
20 |
|
|
Sulphur Dioxide (SO2) |
10-minute |
500 (3) |
4th Max. |
μg m-3 |
52 |
56 |
49 |
49 |
53 |
35 |
49 |
45 |
42 |
59 |
33 |
39 |
33 |
43 |
39 |
|
24-hour |
50 (3) |
4th Max. |
μg m-3 |
9 |
9 |
8 |
8 |
8 |
8 |
8 |
7 |
8 |
8 |
8 |
7 |
7 |
8 |
7 |
|
|
Nitrogen Dioxide (NO2) |
1-hour |
200 (18) |
19th Max. |
μg m-3 |
115 |
112 |
108 |
106 |
104 |
100 |
102 |
100 |
96 |
99 |
89 |
93 |
82 |
90 |
84 |
|
Annual |
40 |
- |
μg m-3 |
32 |
29 |
29 |
26 |
23 |
25 |
23 |
20 |
19 |
21 |
18 |
19 |
18 |
18 |
18 |
|
|
Carbon Monoxide (CO) |
1-hour |
30,000 |
Max. |
μg m-3 |
541 |
541 |
542 |
539 |
537 |
538 |
538 |
540 |
542 |
545 |
538 |
542 |
537 |
540 |
541 |
|
8-hour |
10,000 |
Max. |
μg m-3 |
495 |
495 |
494 |
491 |
486 |
487 |
485 |
488 |
489 |
498 |
484 |
489 |
483 |
487 |
488 |
|
|
Ozone (O3) |
8-hour |
160 (9) |
10th Max. |
μg m-3 |
176 |
178 |
175 |
178 |
180 |
179 |
176 |
188 |
186 |
187 |
187 |
188 |
186 |
187 |
185 |
Notes:
[1] Values in ( ) indicate the number of exceedances
allowed per year
[2] Data extracted from EPD Website (https://path.epd.gov.hk/index_en_2030.html)
3.6.1 Construction Phase
3.6.1.1 Project
Contribution
The key air pollution sources associated with the Project during construction phase would be the dust emission (RSP and FSP) from the construction activities of the Project. The dusty construction activities include:
•
Excavation;
•
Foundation; and
•
Superstructure work.
The foundation works for major I∙PARK2 plant structures will be conducted by non-percussive piling. The shallow raft / pad foundation will be considered for low rise facilities. Excavation activities will be conducted during the construction phase of this Project. However, extensive excavation and transportation of the dusty material would not be expected for this Project. Subject to the detailed design to be carried out by the future I∙PARK2 contractor, approximately 500,000 m3 of construction and demolition (C&D) materials would be generated from 2026 to 2030 as estimated in the reference design, among which about 350,000 m3 of the C&D materials would be reused on site. It is estimated that an average of about 12 truck trips per day would be required for the disposal of inert C&D materials off-site.
Construction vehicles will generally make use of Lung Kwu Tan Road to access the Project site. Air quality emissions from these vehicles will generally be limited within the worksites. Air quality emission from construction site is controlled under the Air Pollution Control (Construction Dust) Regulation, which sets out effective construction air quality control requirements including but not limited to covering the dusty materials and keep ground surface wet by water spraying to suppress the release of construction dust. Vehicle washing facilities including a high pressure water jet shall be provided at vehicle exit point. Construction vehicles will be thoroughly washed and those loaded with dusty materials will be covered by clean impervious sheets prior to leaving the construction site. Hence, the air quality nuisance from construction vehicles outside the construction site is unlikely to be significant. Apart from construction vehicles, 1 to 2 trips per day of barges/ construction vessels for construction works are anticipated. In view of few nos. of trip induced, no adverse construction air quality impact is anticipated from the use of barges/ construction vessels.
Subject to the detailed design to be carried out by the future I∙PARK2 contractor, ten nos. of construction machinery per ha. are estimated to be operated on-site while all the machinery is unlikely to be operated at the same time. The requirements as stipulated in the Air Pollution Control (Non-road Mobile Machinery) (Emission) Regulation will be followed to control potential emissions from non-road mobile machinery. Moreover, timely provision of electricity to construction sites should be arranged as soon as practicable to minimize air quality impact arising from construction machinery. The use of hybrid, electric or clean-fuel NRMMs should also be adopted to further minimise the emissions from NRMMs if practicable. As stated in Section 3.2.10 of this report, exempted NRMM should also be avoided to be used at the construction site as far as practicable. With implementation of mitigation measures, the gaseous and PM emission would be limited.
3.6.1.2 Potential
Concurrent Projects
Potential concurrent projects within the 500 m assessment area were identified. The available details of each project were described below and illustrated in Figure 2.2.
3.6.1.2.1 West New Territories Landfill Extension
Based on current available
information, the WENT Landfill Extension (WENTX) project comprises 4 stages,
i.e. construction, operation, restoration and aftercare phases and will start
to receive waste upon closure of the existing WENT Landfill. The construction
of waste filling cells for WENTX would be divided into phases. The initial
works phase would be conducted from 2023 to 2026 tentatively and it is
anticipated that waste filling at WENTX would commence in 2026. It is included
in the cumulative qualitative construction air quality impact assessment of the
construction works of I∙PARK2 and the quantitative air quality impact assessment
during the operation stage.
3.6.1.2.2 Nim Wan Road (South)
The programme and design of Nim Wan Road (South) are under review and not yet available at the time of preparing this EIA report. Therefore, it is not included in the cumulative air quality impact assessment of the Project.
3.6.1.2.3 Upgrading of Nim Wan Road (North) and Deep Bay Road
As discussed in Section 2.10.3, the
design including the latest layout of the proposed Nim Wan Road (North) is
under review and the proposed construction programme of the proposed Upgrading
of Nim Wan Road (North) and Deep Bay Road is not yet available at the time of
preparing this EIA report. Therefore, it is not included in the cumulative air
quality impact assessment of the Project.
3.6.1.2.4 Tsang Tsui Columbarium
There are 30 furnaces for joss paper burning at Tsang Tsui Columbarium. Based on site survey on 7 May 2024, emissions from these furnaces were very limited. It is expected that joss paper burning would mainly be found during the Ching Ming and Chung Yeung festivals with limited period of burning activities. Moreover, control equipment is installed at the furnaces to minimise the emission of air pollutants. Since the emissions are limited and infrequent, the furnaces were not included in both construction phase and operational phase assessment.
3.6.1.2.5 Decommissioning of West Ash Lagoon in Tsang Tsui
According to DIR-305/2024 Decommissioning of West Ash Lagoon in Tsang Tsui, the tentative programme for the decommissioning work would be approximately 6 months, and tentatively scheduled to commence in 2026. The proposed decommissioning works mainly involve covering of at least 1m thick general fill above the PFA at west ash lagoon, as well as installation of temporary surface drainage system. Site clearance such as vegetation clearance might be required prior to the decommissioning works. The air quality impact arising from the decommissioning works would be minor in view of the nature of the decommissioning activities. With implementation of mitigation measures and good site practice, potential cumulative air quality impact is not anticipated.
3.6.1.2.6 Lung Kwu Tan Reclamation and the Re-planning of Tuen Mun West Area
According to the Project Profile of Lung Kwu Tan Reclamation (ESB-367/2024), the reclamation and associated works are tentatively intended to commence in 2027 the soonest with a view to provide first piece of “developable land” to meet development needs starting from 2030-2031. However, the development options is not yet available at the time of preparing this EIA report. Therefore, no emission sources from the projects is included in the cumulative air quality impact assessment.
3.6.1.2.7 Underground Cable Laying by China Light and Power Company (CLP)
The programme and design of Underground Cable Laying by CLP are not yet available at the time of preparing this EIA report. Given that the cable laying works would be minor in scale and the nature of the works, potential cumulative air quality impacts due to construction and operation of the project are not anticipated.
3.6.2 Operational Phase
3.6.2.1 Gaseous
and Particulate Matter Pollutants
With reference to the prevailing guidance note on the BPM for incinerators (municipal waste incineration) in Hong Kong, the key air pollutants of concern that are associated with the incineration plant of the I∙PARK2 includes the followings:
• Particulates (RSP and FSP);
• Gaseous and vaporous organic substances (total organic carbon (TOC));
• Hydrogen Chloride (HCl);
• Hydrogen Fluoride (HF);
• Sulphur Dioxide (SO2);
• Carbon Monoxide (CO);
• Nitrogen Oxides (NOx);
• Ammonia (NH3) (one of the possible reducing agents to be used in the SCR process);
• Mercury (Hg);
• Total Cadmium & Thallium (Cd & Tl);
• Total Heavy Metal including Antimony (Sb), Arsenic (As), Lead (Pb), Chromium (Cr), Cobalt (Co), Copper (Cu), Manganese (Mn), Nickel (Ni) and Vanadium (V); and
• Dioxins & Furans.
Apart from the key air pollutants of concern above, Beryllium (Be), Zinc (Zn), Selenium (Se), Polychlorinated biphenyls (PCBs) and Polycyclic aromatic hydrocarbons (PAHs) are also identified as potential air pollutants associated with municipal solid waste incinerators based on literature review. The cumulative health impacts of identified non-HKAQO criteria pollutants were assessed in the Health Impact Assessment Chapter.
Aerial emissions from the proposed I∙PARK2 chimney would be controlled to within the target emission levels, which is presented in Section 3.8.1.1.1 of this report. The I∙PARK2 contractor will be required to adopt advanced air pollution control system and ensure compliance with the target air emission levels and criteria for evaluating air quality impact set out in Annex 4 of the EIAO-TM. The air pollution control system shall include a combination of the following techniques:-
• Selective non-catalytic reduction (SNCR) and selective catalytic reduction (SCR) to reduce NOx emissions;
• Dry alkaline sorbent (sodium bicarbonate or lime) injection(s) combined with bag filter(s), semi-dry absorber and/or wet scrubber to reduce acidic gases such as HCl, HF and SO2;
• Dry sorbent (activated carbon) injection combined with bag filter to reduce dioxin, metals and metalloids; and
• Bag filter(s) to reduce particulates.
For TOC, as stated in the best available techniques (BAT) reference document for waste incineration in the European Union (EU), this parameter includes a number of gaseous organic substances, the individual detection of which is generally complex or not possible. A complete account of every substance within the TOC parameter is not available; however, incineration generally provides high destruction efficiencies for organic substances. TOC will be measured continuously as a key indicator for the quality of combustion in the incineration process.
Apart from incineration emission, other emissions associated with the I∙PARK2 include emissions from marine vessels and road traffic vehicles related to the operation of the I∙PARK2.
3.6.2.2 Air
Quality Impact arising from Bottom Ash, Fly Ash and Residues
With reference to the prevailing practice of MSW transportation to landfills, the waste and ash will be fully enclosed in sealed containers or covered entirely to ensure that the waste and ash do not leak from vessels or vehicles during transportation. In addition, fly ash and residues will be treated by cement solidification or chemical stabilisation to ensure compliance of the disposal criteria as stated in Section 6.5.2 of this Report before disposal to landfill. Fugitive emissions during transportation and disposal of waste and ash are not anticipated. The potential air quality impacts associated with transportation and disposal of waste and ash arising from the operation of the Project is expected to be minimal.
Since the reception halls will be enclosed with negative air pressure, fugitive emissions leaking to the outdoor environment are not anticipated. For the storage and treatment of fly ash, they will be conducted within an enclosed environment with air withdrawn through the bunkers into the combustion chamber of the incinerator. The potential air quality impacts associated with storage and handling of waste and fly ash arising from the operation of the Project is also expected to be minimal.
Subject to the detailed design, air exhausts may be provided at the incineration bottom ash (IBA) treatment building. IBA is mainly composed of inorganic oxides, and thus, presents a similar composition to that of geological materials. Based on studies of IBA in Denmark [1], major constituents of IBA (up to 90%) are silicon dioxide, calcium oxide, aluminium oxide and ferric oxide as found in roughly the same order of magnitude in the lithosphere, with some trace metal elements which may be more or less enriched in IBA as compared to the lithosphere. In addition, organic substances such as PCB, PAH, dioxins and furans are present in very small quantities in IBA and hence aerial emissions of organic substances from the proposed IBA treatment plant would be negligible.
During the IBA treatment processes, dust and metal may be emitted from IBA handling, shredding, sieving, and air separation. The IBA treatment and associated equipment such as shredder, sieve, conveyor belts etc. will be enclosed in buildings with negative pressure. Any free fall transfer point e.g. from conveyor belt and stockpiles will also be enclosed in buildings and the drop height will be minimized to reduce dust emission. Misting system will be installed as fugitive emission control inside the IBA facility. The processes for IBA will be wet in nature. In addition, fabric filters with 99% removal efficiency will be installed at the IBA facility to remove dust and metals (if any).
Processing of IBA using wet treatment and separation of metals from IBA using magnetic separation (for ferrous metals) and eddy current separation (for non-ferrous metals) would also reduce aerial emissions of metals from the proposed IBA treatment plant. With proper implementation of the above techniques to reduce emissions to air from the proposed IBA treatment plant including provision of bag filter with 99% removal efficiency to treat the extracted air, it is anticipated that aerial emissions of metals from the proposed IBA treatment plant would be minimal. Dust exhausts from the IBA facilities were assumed in this assessment to demonstrate the worst-case scenario during operational phase.
It should be noted that the proposed IBA treatment plant would involve mineral works which is a specified process under the APCO as presented in Section 3.2.1 and the future I∙PARK2 contractor shall be required to obtain a licence from EPD and comply with the terms and conditions in the licence.
3.6.2.3 Odour
Impacts
Odorous ammonia, which is one of the possible reducing agents to be used in the Selective Catalytic Reduction (SCR) process, may be emitted from the flue gas of the Project. Cumulative quantitative odour impact assessment is conducted for ammonia.
Odour emissions from incineration plant are identified as another source causing potential odour nuisance to the adjacent sensitive receivers. According to BAT 21 of the Best Available Techniques (BAT) Reference Document for Waste Incineration, Industrial Emissions Directive 2010/75/EU (Integrated Pollution Prevention and Control) (EU, 2019), in order to prevent or reduce odour emissions from incineration plant, the BAT is to store the wastes that are odorous and / or prone to releasing volatile substances in enclosed buildings under controlled sub-atmospheric pressure and use the extracted air as combustion air for incineration. By enclosing the waste storage areas and limiting the size of the entrances to the waste storage areas, the whole waste storage area can be maintained under a slight sub-atmospheric pressure. This reduces the risk of odour releases and ensures that odorous substances are destroyed in the incinerator rather than released. For the Project, the BAT 21 as stated above will be adopted and the facilities including the wastewater treatment facility, waste reception hall, waste storage areas and waste feed system will be fully enclosed (except the entrances) and maintained at negative pressure by withdrawing the air through the bunkers. Exhaust air of the wastewater treatment facilities, waste reception hall, waste storage area and waste feed system will go through the combustion chamber of the incinerator. The incinerator furnace will be designed to ensure effective destruction of odorous substances in the waste gas. Combustion gas temperature, residence time, air supply and gas turbulence will be adequately and properly controlled to achieve this requirement. The incinerator shall be designed, equipped, built and operated in such a way that the waste is thoroughly combusted at high temperature above 850℃ with sufficient air supply under high turbulent condition. The flue gas is required to stay at this high temperature for at least two seconds to breakdown odorous substances in the waste gas. Based on the literature review, odour removal efficiency of over 99% is achievable for typical thermal incinerator[2]. Air pollutants generated from the incineration process will be treated by advanced air pollution control system including activated carbon and bag filter which would also adsorb and capture odorous substances (odour removal efficiency of more than 95% is achievable by common odour abatement systems available in the market), if any not destroyed in the incinerator prior to emission into the atmosphere via the stack of I∙PARK2. Therefore, odorous emission from the chimney of incinerator is very limited or negligible. In addition, odour control system with odour removal efficiency of more than 95% shall be provided for treatment of odorous air before discharging into open atmosphere during a shut-down or under the circumstances that the odorous air cannot be withdrawn into the combustion chamber of the incinerator for combustion. The frequency of shut-down and the odorous air cannot be drawn to the combustion chamber is very limited/ rare and hence it will not result in adverse odour impact on the nearby ASRs. The odour samples will be collected at the inlet and the outlet of the odour control system upon commissioning to verify the odour removal efficiency of the odour control system.
The unloading of waste will be conducted within the enclosed tipping hall with negative-pressure condition. The extracted air within the tipping hall shall be incinerated in the combustion chamber and treated by the odour control system before discharge to ambient environment under normal operation. Besides, the wastes will be transported to I∙PARK2 by refuse collection vehicles which would be enclosed by metal tailgate covers, or in purpose-built sealed containers by waste container handling trucks or vessels to minimise or avoid odour leakage during transportation, adverse odour impact arising from the transportation of wastes is therefore not expected. Nevertheless, odour patrol will be carried out during operation of the Project as presented in Section 3.12.2 of this report to ensure that there would be no adverse odour impact arising from the Project.
As discussed in Section 3.6.1.1, major construction works would include foundation and superstructure works. Under the APCO, air quality mitigation measures stipulated in the Air Pollution Control (Construction Dust) Regulation should be implemented. With effective implementation of these mitigation measures, adverse construction air quality impacts are not expected at the ASRs. Quantitative assessment on construction air quality impact is therefore considered not necessary.
3.8.1 Cumulative Operational Air
Quality Impact Assessment
- Gaseous and
Particulate Matter Emissions
Cumulative air quality impacts at the identified ASRs due to pollutant emission sources within 500 m from the project boundary and within Areas of Influence (AoIs), and major pollutant emission sources (within 4 km) were considered. These emission sources include:
• Castle Peak Power Stations A and B (CPA & CPB);
• Black Point Power Station (BPPS);
• T∙PARK;
• WENT Landfill & its Extension;
• Industrial Emissions (within 500 m and AoIs);
• Traffic Emissions (within 500 m and AoIs); and
• Emissions from marine vessels travelling and berthing near the Project site (within 500 m and AoIs).
Cumulative air quality impact assessment was carried out for the representative ASRs located within the identified AoIs and within the 500 m assessment area. Pollution contours for each AoI and within the 500 m assessment area were produced to present the concentration of the pollutants within each AoI and within the 500 m assessment area.
A three-tier approach recommended in the EPD’s Guidelines on Assessing the ‘Total’ Air Quality Impacts was followed to assess the potential cumulative air quality impact at the identified AoIs and within 500 m assessment area:
• Tier 1: Project contribution;
• Tier 2: Emission sources within 500 m from the Project site boundary and within the AoIs, major point sources within 4 km from the Project site boundary; and
• Tier 3: Ambient background.
The background concentration was adopted for the first year of operation of the Project (i.e. in 2030) as it is anticipated that background concentrations resulting from roads, power generation and regional sources will continue to improve in the future. The vehicular and marine emission impact were based on the highest emission strength in the assessment area/ AoIs within the next 15 years upon commissioning of the Project.
The three-tier approach provides a conservative cumulative air quality impact assessment that has separately considered:
• Stack emissions from the I∙PARK2 and operation-related emission including barge and road traffic within the assessment area and AOIs;
• Emissions from non-Project emission sources within the assessment area/ AoIs, including but not limited to marine and industrial emissions;
• Vehicular emissions from roads within the assessment area/ AoIs; and
• PATH background in year 2030 with removal of emissions from vehicular and industrial sources that have been accounted for in Tier 2.
The modelling approach adopted was listed in the following:
• AERMOD model was used to assess the chimney emission impact from the I∙PARK2 on the ASRs;
• AERMOD model was used to simulate the impact from line sources including open road emissions within assessment area and AoIs on the ASRs; and
• AERMOD model was used to simulate the impact from other point, area and volume sources emissions within assessment area and AoIs on the ASRs.
3.8.1.1 Project
Emission Inventory
3.8.1.1.1 Emissions from I∙PARK2
The stack discharge parameters from the incineration plant as proposed in the reference design is summarized in Table 3-6. The stack design of the I∙PARK2 would meet the requirements set out in the prevailing guidance note on the best practicable means (BPM) for incinerators (municipal waste incineration) in Hong Kong. The I∙PARK2 chimney emissions were modelled as point sources emission.
Table 3‑6 Operation Parameters of the Incineration Plant [1]
|
Oxygen content of flue gas |
8.6% |
|
% moisture in flue gas |
21.8% |
|
Temperature of the flue gas |
413K |
|
Total flow rate of flue gas under standard condition [2] |
1,650,000 Nm3/hr |
|
Exit velocity |
19.265 m/s [3] |
|
Total cross-sectional area of the six flues |
36.9 m2 |
|
Stack height |
70 mAG |
|
Equivalent stack diameter for the six flues [4] |
6.86 m |
Note:
[1] The operation parameters are provided by design engineer for the reference design and subject to the detailed design to be carried out by the future I∙PARK2 contractor.
[2] Expressed at 0 degrees Celsius temperature, 101.325 kPa pressure, dry and 11% oxygen content.
[3] For the purpose of the air quality modelling to simulate the emissions from the six flues as a single point of stack emission, the exit velocity in the air quality model is divided by the square root of the number of flues (i.e. 6) as a conservative approach. Exit velocity of 7.865 m/s was adopted in the model run.
[4] The diameter of each flue is about 2.8 m. When modeling the stack emission with six flues in close proximity, the plumes emitted from the six flues would inevitably become a combined plume shortly after discharge. Therefore, for the purpose of the air quality modelling, the emissions from the six flues were modelled as a single point of stack emission.
The I∙PARK2 shall be designed to meet the target air emission levels for the incinerator in Appendix 3C by making reference to the standards for pollution control on the MSW incineration in the Mainland China (GB 18485-2014) and Shenzhen (SZDB/Z 233-2017), the best available techniques (BAT) reference document for waste incineration in the European Union (EU), as well as the prevailing guidance note on the BPM for incinerators (municipal waste incineration) in Hong Kong. In particular, the I PARK2 will meet a more stringent target hourly NOx emission level of 60 mg/Nm3 with a view to minimising potential air quality impact. Subject to the detailed design to be carried out by the future I∙PARK2 contractor, the operation parameters of the incineration plant for the I∙PARK2 as proposed in the reference design are listed in Table 3-6. The detailed emission parameters of the concerned air pollutants for air quality impact assessment are presented in Appendix 3D. The key / representative air pollutants emitted from the stack as adopted in the EIA report shall be monitored in accordance with the prevailing guidance note on the BPM for incinerators (municipal waste incineration) in Hong Kong to demonstrate compliance with the target air emission levels, with the details of the monitoring requirements provided in the EM&A Manual.
It should be noted that the incinerator at I∙PARK2 is a specified process under the APCO as presented in Section 3.2.1 and the future I∙PARK2 contractor shall be required to obtain a licence from EPD and comply with the terms and conditions in the licence.
For the potential dust emission from IBA facilities, the detailed emissions inventory is presented in Appendix 3D.
3.8.1.1.2 Vehicular Emissions associated with the I∙PARK2
During the operation phase of the I∙PARK2, traffic associated with trucks delivering MSW and maintenance equipment as well as coach for employee and visitors to the I∙PARK2 are anticipated. Vehicular emissions (including start and running emissions from the trucks and coaches within I∙PARK2) associated with the I∙PARK2, the 500 m assessment area and within AoIs were included in the assessment.
All roads within 500 m assessment area and AOIs with roadside parking have considered start emission in broad-brush approach.
3.8.1.1.3 Marine Emissions associated with the I∙PARK2
Currently, the MSW collected at Island East Transfer Station (IETS), Island West Transfer Station (IWTS), Outlying Islands Transfer Station (OITS), West Kowloon Transfer Station (WKTS) and North Lantau Transfer Station (NLTS) is delivered to the WENT Landfill by marine transport. Upon commissioning of the I∙PARK2, the MSW collected from relevant refuse transfer stations will be delivered to either the waste-to-energy (WtE) facilities or the berth area of WENT Landfill. The MSW collected at WKTS shall be delivered to I∙PARK1 under normal operation. Marine emissions within the assessment area including berthing and maneuvering emissions from marine vessels (i.e. barges, derrick lighter, tugboat), which may give rise to RSP, FSP, CO, NO2 and SO2 impacts, will be included in the assessment. On-shore power supply facilities should be provided for use by marine vessels with such facilities. This will enable marine vessels to switch to electric power while berthing and hence minimise the impact on air quality. The detailed RSP, FSP, CO, NO2 and SO2 emission rate calculations, assumptions and emission inventory are provided in Appendix 3E.
3.8.1.2 Non-Project
Emissions within AoIs and the Assessment Area
Emission sources within AoIs and the assessment area that have contribution to cumulative air quality impact were considered in the assessment. The potential chimneys to be included in the cumulative quantitative impact assessment includes the followings:
• Black Point Power Station (BPPS);
• Emissions from gas heaters at the existing Gas Receiving Station (GRS)
• Emissions from gas heaters at the planned GRS
• Main stack emissions from existing gas-fired generation units
• Main stack emissions from the two combined-cycle gas turbine (Units D1 and D2)
• T∙PARK;
• WENT Landfill and its Extension;
• Castle Peak Power Stations A and B (CPA & CPB);
• CLP LFG power generation units;
• Asphalt plants;
• Concrete batching plants; and
• Other industrial chimneys identified within AoIs and the assessment area.
The emission inventory and stack information of the potential air emission sources were referenced to the best available information from relevant SP licenses and approved EIA Reports. Site surveys for identification of industrial chimneys were carried out on 5 July 2023 and 21 June 2024. The location and emission inventory of the identified chimneys considered in the cumulative impact assessment are presented in Appendix 3F.
The dust emission inventory of WENTX for cumulative RSP and FSP impact assessments were presented in Appendix 3H. According to the Air Quality Impact Assessment Report of WENTX[3] and considering I∙PARK2 is targeted to be commissioned in year 2030, 2 representative scenarios, i.e. Scenarios 8 and 10-1 (of the WENTX AQIA report), would be included in the assessment to represent the highest RSP and FSP emission impact from WENTX. The dust emissions of each dusty activity from each cell (WENTX landfill cells) under two scenarios would be assessed simultaneously at all representative ASRs as a conservative scenario.
3.8.1.2.1 Vehicular Emission within AoIs and the Assessment Area
Vehicular emission from open roads within 500 m from the Project boundary and within AoIs were considered in the cumulative impact assessment.
Since the commencement year of the I∙PARK2 is 2030, a sensitivity test for vehicular emission from the open roads in year 2030, 2037 and 2045 have been conducted and the result is presented in Table 3-7. The predicted traffic flow and emission for different years are presented in Appendix 3G. Year 2030 was found to have the highest traffic emission. Therefore, combination of vehicle emission factor and predicted traffic flow in Year 2030 were chosen as the worst case scenario for the vehicular emission impact. The Transport Department (TD) has advised no in-principle objection to the methodology for the traffic forecast conducted under the Project (Appendix 3G).
Table 3‑7 Sensitivity Test Result for Vehicular Emission from Open Roads in Years 2030, 2037 and 2045
|
Pollutants |
Temperature and Relative Humidity Profile Used |
Total Vehicular Emission (tonne per year) [1] |
||
|
Year 2030 |
Year 2037 |
Year 2045 |
||
|
NOx |
Annual Minimum |
73.25 |
53.70 |
53.27 |
|
FSP |
Annual Minimum |
2.08 |
0.94 |
0.90 |
|
RSP |
Annual Minimum |
2.26 |
1.02 |
0.98 |
|
Note: [1] The total vehicular emission was generated from SAMP v2.0. |
||||
The latest version of the EMFAC-HK v4.3 model was adopted to estimate the emission rates of vehicles for oxides of nitrogen and particulate matter. Tsang Tsui Columbarium Bus Terminus and Ha Pak Nai Terminus were identified within 500m boundary from the Project and within the AoIs. There is one bus route and one trip at Tsang Tsui Columbarium Bus Terminus per hour, 3 trips of minibuses and 2 to 3 trips of coaches at Ha Pak Nai Terminus per hour. In view of the few nos. of bus/minibuses/coaches per hour, broad brush approach was adopted for start emission calculation of bus/minibuses/coaches in the assessment. All roads within 500 m assessment area and AOIs with roadside parking have considered start emission in broad-brush approach. All types of vehicles were considered for start emission.
The road segments and corresponding predicted traffic flow were imported into EPD’s Smart Air Modeling Platform (SAMP). Zero EV scenario was not used in the assessment. The total composite emission rate calculated by SAMP contains the running emissions and start emissions by broad-brush approach. For calculations of start emissions by the broad-brush approach, start emissions for each vehicle class are assumed directly proportional to Trips per Vehicle-kilometre-travelled ratio (Trip/VKT) with consideration of the proportion of local and rural roads within Hong Kong based on the Annual Traffic Census (ATC) prepared by the Transport Department (TD). For SAMP v2.0, default trip and VKT values from EMFAC-HK model v4.3 are used in the calculations and the proportion of local and rural roads within Hong Kong of 14.34% is assumed based on ATC 2022.
The traffic emission rates and the related modelling input files were generated by using the Smart Air Modelling Platform v2.0 (https://aqia.epd.gov.hk/). The summary tables collected from the platform were presented in Appendix 3G. As a conservative approach, vehicular emission rates with diurnal profiles of monthly lowest and monthly average temperature and relative humidity were adopted for assessing the short-term and annual traffic NO and NO2 impact, respectively. Vehicular emission rates with a diurnal profile of annual lowest temperature and relative humidity were adopted for assessing traffic RSP and FSP impact. The details of the emission rate are presented in Appendix 3G. As NOx and PM are the critical air pollutant of concern for vehicular emission impact assessment, the concentrations of NO, NO2, RSP and FSP from open roads were modelled by AERMOD in the assessment.
3.8.1.3 Background
Contribution
As suggested by “Guidelines on Assessing the ‘TOTAL’ Air Quality Impacts”, an integrated modelling system, Pollutants in the Atmosphere and their Transport over Hong Kong model (PATH v3.0) which is developed and maintained by EPD was applied to estimate the background pollutant concentrations.
The PATH v3.0 emission inventory was updated to remove emissions from vehicular and industrial sources that were considered in Tier 2, and the PATH v3.0 model was rerun to generate the background for Tier 3 in this assessment. Emissions of SO2, NOx, PM10 and PM2.5 from the following sources are removed in the re-run PATH:
• T∙PARK;
• WENT Landfill;
• Two asphalt plants in Lung Kwu Tan;
• BPPS;
• CPPS;
• Green Island Cement Plant; and
• Vehicular emissions.
3.8.1.4 Dispersion
Modelling & Modelling Approach
According to the Model Guidelines, the steady-state Gaussian dispersion model United States Environmental Protection Agency (USEPA) AERMOD model is adopted for assessing the potential air quality impact arising from the operation of the Project. Hourly meteorological data from PATH v3.0 of the concerned grids were adopted in the model run. Mixing heights from the PATH v3.0 which are lower than the minimum mixing height recorded by the Hong Kong Observatory (HKO) in Year 2019 (i.e. 119m) were capped at 119m. Mixing heights from the PATH v3.0 which are higher than the maximum mixing height recorded by the Hong Kong Observatory (HKO) in Year 2019 (i.e. 2009m) were capped at 2009m. For the treatment of calm hours, the wind speeds are capped at 0.5 m/s for those from PATH v3.0 below 0.5 m/s. Building downwash effect was accounted for in the AERMOD modeling system. The details of building parameters are shown in Appendix 3I.
3.8.1.4.1 Surface Characteristics
Details of the surface characteristics of the grids are extracted from EPD’s Smart Air Modelling Platform (SAMP) and presented in Appendix 3J. The surface characteristics in the vicinity of the assessment area were based on the 2022 land utilization file disclosed by the Planning Department. In addition, the land use characteristics of the area within boundary of Lung Kwu Tan Reclamation project were updated from open sea to industrial land for this assessment.
3.8.1.4.2 Vehicular Emission from Open Roads
AERMOD is used to assess the air quality impact due to vehicular emission. The details of the emission rate were extracted from EPD’s SAMP and presented in Appendix 3G. NO, NO2, RSP and FSP concentrations were modelled by AERMOD in the assessment.
3.8.1.4.3 Estimation of SO2 Concentration
For the estimation of SO2 Concentration, EPD’s “Guidelines on the Estimation of 10-minute Average SO2 Concentration for Air Quality Assessment in Hong Kong” was followed. The stability-dependent multiplicative factors for converting 1-hour average concentrations to 10-minute average concentrations are extracted in Table 3-8 below.
Table 3‑8 1-hour to 10-minute Conversion Factors
|
Pasquill Stability Class [1] |
A |
B |
C |
D |
E |
F |
|
Conversion Factors |
2.45 |
2.45 |
1.82 |
1.43 |
1.35 |
1.35 |
[1] Pasquill-Gifford stability class hour by hour from the PATH v3.0 was adopted.
3.8.1.4.4 Conversion of NOx to hourly NO2 concentration
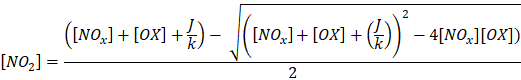
The hourly concentration of the NO2 was calculated using the Ozone Limiting Method. For tailpipe emission, the NO2:NOx ratio is determined based on NO and NO2 emission rates from the EMFAC-HK model. For industrial chimneys, the in-stack NO2:NOx ratio is assumed to be 10% in accordance with EPD’s “Guidelines on Choice of Models and Model Parameters” . The hourly background Ozone concentration from PATH v3.0 (Year 2030) data was used for the conversion.
The total predicted NO2 concentrations for short-term cumulative assessment were calculated as follows:

where
[NO2] pred total = the total predicted NO2 concentration
[NO2] pred t = the predicted NO2 concentration directly emitted from tailpipe emission
[NOx]pred i = the predicted NOx concentration directly emitted from industrial chimneys
[NO] pred t = the predicted NO concentration directly emitted from tailpipe emission
MIN means the minimum of the two values within the brackets
[O3] bkgd = the representative O3 background concentration
(46/48) = the molecular weight of NO2 divided by the molecular weight of O3
3.8.1.4.5 Conversion of NOx to annual NO2 concentration
Other than the Ozone Limiting Method, the Jenkin’s method was considered to avoid over-estimation of the annual NO2 emission impact. With reference to Review of Methods for NO to NO2 Conversion in plumes at short ranges[4], Jenkin’s method was adopted for the conversion of cumulative NOx to NO2 by using the functional form of annual mean of NO2-to-NOx.
The total predicted NO2 concentrations for long-term cumulative assessment were calculated as follows (Jenkin, 2004a)[5]:
where
[NO2] = the total predicted NO2 concentration
[NOx] = the predicted NOx concentration
[OX] = the sum of NO2 concentration and O3 concentration
J = the photolysis rate of NO2
k = the rate coefficient for reaction between NO and O3
The above functional form was used to analyse the annual mean data obtained from EPD’s air quality monitoring stations including Tuen Mun general station, Tap Mun general station and Mong Kok roadside station. The Tuen Mun general station is the nearest station and therefore chosen as the representative station. Tap Mun general station and Mong Kok roadside station are also included in order to cover a wider range of NOx concentration. The data analysis and derivation of cumulative annual average NOx to NO2 conversion equation using Jenkin’s Method for this assessment are shown in Appendix 3K. The functional form curve would fit the annual mean data when [OX] = 95.57 mg/m3 and J/k = 17.114 mg/m3. The obtained functional form curve was adopted for the cumulative annual average NOx to NO2 conversion.
3.8.1.5 Cumulative
Operational Air Quality Impact - Gaseous and Particulate Matter Pollutants
Cumulative operational air quality impacts upon ASRs were derived from the sum of prediction results from AERMOD (Tier 1 and Tier 2 contributions) and predicted background concentrations from PATH v3.0 Year 2030 on hour-by-hour basis. The relevant time period averages (namely hourly, daily and annual) for each pollutant were derived from the cumulative hour-by-hour results. Cumulative average predictions at each ASR amongst 365 days or 8760 hours were ranked by highest concentration and compared with the maximum allowable concentration to determine the number of exceedances throughout a year. The highest relevant averaged concentration for each pollutant was compared with corresponding AQO criteria to evaluate the cumulative air quality impact at the identified ASRs.
3.8.2 Cumulative Operational Air Quality Impact Assessment - Odour
Impacts
3.8.2.1 Odour
Emission Inventory of I∙PARK2
Potential odour sources identified from the Project includes the following:
• Ammonia emission from SCR process
• Exhaust from tipping hall
Facilities including the wastewater treatment facility, waste reception hall, waste storage areas and waste feed system will be fully enclosed (except the entrances) and maintained at negative pressure by withdrawing the air through the bunkers into the combustion chamber for incineration and treated by flue gas treatment system, as stated in Section 3.6.2.3. Consideration of odour emission from the waste reception hall through an odour control system with more than 95% odour removal efficiency for treatment of odorous air from the waste reception hall during a shut-down or under the circumstances that the odorous air cannot be withdrawn into the combustion chamber of the incinerator for combustion is a conservative approach for odour impact assessment. The emission parameters of ammonia and the potential odour emission from waste reception hall are presented in Appendix 3C and Appendix 3D.
3.8.2.2 Odour
Emission within the Assessment Area
Potential adjacent odour emission sources within the 500 m assessment area include the following:
• WENTX; and
• T∙PARK.
The odour emission from WENTX and T∙PARK were considered in the cumulative odour impact assessment. The details of odour emission from WENTX and T∙PARK are presented in Appendix 3L.
3.8.2.3 Dispersion
Modelling & Modelling Approach
AERMOD, the EPD approved air dispersion model, was employed to predict the cumulative odour impact from the operation of the Project and odour sources within 500 m assessment area at the representative ASRs. Odour emission from stacks and exhaust of deodorization units were modelled as point sources in the assessment while open tanks were modelled as area source in the assessment. The operation time of emission sources at WENT Landfill & its extension and T∙PARK is presented in Appendix 3L.
The modelled hourly averaged odour concentrations at the ASRs by the AERMOD was converted into 5-second averaged odour concentrations for comparison with the odour assessment’s criterion stipulated in the EIAO-TM. A set of conversion factors stipulated in “Approved Methods for Modelling and Assessment of Air Pollutants in New South Wales” published by the Department of Environment and Conservation, New South Wales, Australia was adopted in this assessment. As some of the potential adjacent odour emission locations were located at ground level, at the top of the deodorization units or building roof of the odour control buildings which would be less than 2.5 times of building structures. Therefore, building wake effect is expected. The conversion factors stated in this method are for converting 1-hour averaged concentrations to 1-second averaged concentration for near field regions.
In the assessment, the conversion factors are to be directly adopted for converting 1-hour averaged concentrations to 5-second averaged concentration as a conservative approach. The conversion factors for different stability classes are shown in Table 3-9.
Table 3‑9 1-hour to 5-second Conversion Factors for Odour and NH3
|
Pasquill Stability Class [1] |
Conversion Factor [2] |
|||
|
Area Source |
Point Source |
|||
|
1-hour to 5-sec Conversion Factor |
1-hour to 5-sec Conversion Factor |
Conversion Factor from NH3 Concentration (1 mg/m3) to Odour Unit [3] |
Conversion Factor from 1-hr average concentration (1 mg/m3) directly to 5-second Odour Unit (OU) |
|
|
A |
2.5 |
2.3 |
0.0386 |
0.0888 |
|
B |
2.5 |
2.3 |
0.0386 |
0.0888 |
|
C |
2.5 |
2.3 |
0.0386 |
0.0888 |
|
D |
2.5 |
2.3 |
0.0386 |
0.0888 |
|
E |
2.3 |
2.3 |
0.0386 |
0.0888 |
|
F |
2.3 |
2.3 |
0.0386 |
0.0888 |
Note:
[1] The hourly Pasquill-Gifford stability class from PATH v3.0 output was adopted.
[2] Reference to Approved Methods for Modelling and Assessment of Air Pollutants in New South Wales published by the Department of Environment and Conservation, New South Wales, Australia. The derivation of the peak-to-mean ratios stated in the method was based on experimental and theoretical analyses and had assumed a 0.1% exceedance level (With reference to “Statistical Elements of Predicting Water Science and Technology, Australia, 44:0 pp 157-164, 2001” )
[3] Odour threshold of NH3 is 0.0259 mg/m3 (0.037 ppm), reference from the approved EIA report of Yuen Long Effluent Polishing Plant (AEIAR-220/2019).
3.8.2.4 Cumulative
Operational Air Quality Impact - Odour Impacts
Cumulative odour impacts on ASRs were derived from the sum of model predictions of project contribution and adjacent emission sources. 5-second averaged results were obtained from the cumulative hour-by-hour results. The maximum cumulative 5-second averaged predictions at each ASR amongst 8760 hours were compared against the odour criterion of 5 OU/m3 as stipulated in the EIAO-TM.
3.9.1 Construction Phase
3.9.1.1 Project
Contribution
Construction activities at the I∙PARK2 will involve superstructure works and installation of associated utilities facilities. Extensive excavation works is not expected. Subject to the detailed design to be carried out by the future I∙PARK2 contractor, approximately 500,000 m3 of C&D materials would be generated from 2026 to 2030 as estimated in the reference design, among which about 350,000 m3 of the C&D materials would be reused on site. It is estimated that an average of about 12 truck trips per day would be required for the disposal of inert C&D materials off-site.
Air quality emission from construction site is controlled under the Air Pollution Control (Construction Dust) Regulation, which sets out effective construction air quality control requirements including but not limited to covering the dusty materials and keep ground surface wet by water spraying to suppress the release of construction dust. Vehicle washing facilities including a high-pressure water jet shall be provided at vehicle exit point. Construction vehicles will be thoroughly washed and those loaded with dusty materials will be covered by clean impervious sheets prior to leaving the construction site. With proper implementation of air quality control measures under the Air Pollution Control (Construction Dust) Regulation, significant construction air quality impacts at ASRs during the construction phase of the Project is not anticipated. Construction air quality monitoring and environmental site inspections are recommended to be carried out during the construction phase to ensure the proper implementation of the air quality control measures and to ensure that there would be no adverse construction air quality impact at nearby ASRs arising from the Project.
Air quality emissions from the construction vehicles will generally be limited within the work sites. Watering facilities will be provided at all vehicular egress. All construction vehicles will be thoroughly washed and those loaded with dusty materials will be covered by clean impervious sheets prior to leaving the construction site. Hence, the air quality nuisance from construction vehicles outside the construction site is unlikely to be significant.
Subject to the detailed design to be carried out by the future I∙PARK2 contractor, only 1 to 2 trips per day of construction barges/ vessels are anticipated during construction phase. For construction vessels, the Air Pollution Control (Marine Light Diesel) Regulation was introduced on 1 April 2014 to cap the sulphur content of locally supplied marine light diesel at 0.05%. In addition, the Air Pollution Control (Fuel for Vessels) Regulation took effect on 1 January 2019, requiring all vessels to use compliant fuel (including fuel with sulphur content not exceeding 0.5% or liquefied natural gas) within Hong Kong waters, irrespective of whether they are sailing or berthing. In view of few nos. of trips of construction barges/ vessels and provided that the future I∙PARK2 contractor shall ensure compliance with the above statutory requirements, no adverse construction air quality impact is anticipated from the use of construction barges/ vessels.
As stated in Section 3.6.1.1, ten nos. of construction machinery per ha. are estimated to be operated on-site while all the machinery is unlikely to be operated at the same time. The requirements as stipulated in the Air Pollution Control (Non-road Mobile Machinery) (Emission) Regulation will be followed to control potential emissions from non-road mobile machinery. Control measures as specified in Section 3.10.1 would be carried out for minimization of air quality impact from Construction Machinery. With the Air Pollution Control (NRMM) (Emission) Regulation and the proposed mitigation measures, adverse air quality impact from the Construction Machinery is not anticipated.
3.9.1.2 Potential
Concurrent Project
As discussed in Section 3.6.1.2, only WENTX are taken into consideration of cumulative construction air quality impact assessment. According to the approved EIA and Final Air Quality Impact Assessment reports of WENTX, no adverse air quality impacts due to the construction and operational phases of the WENTX is anticipated. Air quality control measures under the Air Pollution Control (Construction Dust) Regulation will be implemented under both this Project and WENTX. Besides, regular dust monitoring at the nearby ASRs will be conducted under WENTX. Close liaison between the contractors of I∙PARK2 and WENTX would be maintained for minimization of concurrent construction air quality impacts. With proper implementation of control measures under the Air Pollution Control (Construction Dust) Regulation by the respective contractors, no adverse cumulative construction air quality impacts is expected at nearby ASRs.
3.9.2 Operational Phase (Gaseous and Particulate
Matter Emission)
The predicted cumulative air quality impact (RSP, FSP, NO2, SO2, CO and Pb) including the contributions from Tier 1, 2 and 3 emission sources to the ASRs during operation of the I∙PARK2 are presented in Table 3-10. The detailed result is presented in Appendix 3M. According to the predicted results in Table 3-10, the concentrations of the AQO criteria pollutants (RSP, FSP, NO2, SO2, CO and Pb) at all representative ASRs would comply with the respective prevailing AQOs as well as the proposed AQOs with a view to implementing in 2025 tentatively (see Table 3-2). Therefore, no adverse air quality impact due to gaseous and particulate matter emission from the operation of the I∙PARK2 at the representative ASRs is anticipated.
For the cumulative RSP / FSP emission impact, the assessment is based on the assumed RSP / FSP emission rate of 0.1253 g/s from the proposed IBA treatment plant as presented in Appendix 3D. According to sensitivity analysis with higher RSP / FSP emission rate of 1 g/s from the proposed IBA treatment plant, the highest cumulative RSP / FSP impacts among all assessed representative ASRs are also predicted to comply with both the prevailing and proposed AQOs. Although no CO emissions were included for vehicular and some industrial chimney emission sources based on the latest available information, the predicted CO concentration as well as the background data (as shown in Table 3-4 and Table 3-5) show a large buffer from AQOs. It is anticipated that the Project would not cause any exceedance of the AQO for CO at the ASRs.
Contour plots at the worst impact levels (4 mAG for annual averaged RSP and Pb, 10 mAG for 4th highest 10-min averaged SO2 and 1.5 mAG for remaining) within AoIs were provided and presented in Appendix 3N. It is confirmed that no ASRs are identified within exceedance zones. For the future top-side development at Lung Kwu Tan reclamation area, a detailed EIA will be conducted by CEDD at the EIA stage of the development of Lung Kwu Tan reclamation area
For future indoor sensitive uses within I∙PARK2, central air conditioning will be provided, and fresh air intakes will be carefully positioned and provided with proper dust / NO2 filters to ensure compliance with the AQOs at these sensitive uses. The air filtering system and NO2 removal efficiency will be further reviewed in detailed design stage to ensure that the air quality impacts at all sensitive uses within I∙PARK2 could comply within the AQOs.
Table 3‑10 Predicted Cumulative Gaseous and Particulate Matter Pollutants (RSP, FSP, NO2, SO2, CO and Pb) Concentrations at Representative Air Sensitive Receivers [1]
|
Representative Air Sensitive Receiver |
Assessment Height (mAG)
|
10th Highest Daily
Average RSP Conc. (mg/m3) [2]
|
Annual Average RSP Conc. (mg/m3)
|
19th Highest Daily
Average FSP Conc. (mg/m3) [2]
|
Annual Average FSP Conc. (mg/m3)
|
19th Highest Hourly
Average NO2 Conc. (mg/m3) [2]
|
Annual Average NO2
Conc. (mg/m3)
|
4th
|
4th Highest Daily
Average SO2 Conc. (mg/m3) [2]
|
Highest 8-hour Average CO Conc. (mg/m3)
|
Highest 1-hour Average CO Conc. (mg/m3)
|
Annual Average Pb Conc. (mg/m3)
|
Prevailing AQOs
|
100(9)
|
50
|
50(18)
|
25
|
200 (18)
|
40
|
500 (3)
|
50 (3)
|
10,000
|
30,000
|
0.5
|
|
New AQOs [3]
|
75(9)
|
30
|
37.5(18)
|
15
|
200 (18)
|
40
|
500 (3)
|
40 (3)
|
10,000
|
30,000
|
0.5
|
|
TPO1 [4]
|
39
|
40.1 (0)
|
16.9
|
24.2 (1)
|
11.2
|
123.3 (0)
|
26.0
|
242.9 (0)
|
24 (0)
|
487
|
540
|
0.03
|
TPO2 [4]
|
42
|
40.4 (0)
|
17.0
|
24.2 (1)
|
11.4
|
127.2 (0)
|
26.5
|
244.5 (0)
|
24.1 (0)
|
487
|
540
|
0.03
|
WXO1 [4]
|
1.5
|
41.8 (0)
|
17.7
|
24.8 (2)
|
11.1
|
129.8 (0)
|
26.8
|
245.2 (0)
|
23.3 (0)
|
490
|
541
|
0.02
|
TTC1
|
4
|
54.1 (0)
|
21.4
|
32 (0)
|
13.7
|
126.4 (0)
|
28.5
|
255.6 (0)
|
23.1 (0)
|
489
|
539
|
0.04
|
BPS1
|
1.5
|
53.4 (0)
|
20.6
|
30.1 (0)
|
13.0
|
120.9 (0)
|
31.6
|
235.3 (0)
|
23.4 (0)
|
486
|
537
|
0.02
|
BPS1
|
5
|
53.4 (0)
|
20.6
|
30.1 (0)
|
13.0
|
120.7 (0)
|
31.4
|
235.6 (0)
|
23.1 (0)
|
486
|
537
|
0.02
|
BPS1
|
10
|
53.4 (0)
|
20.6
|
30.1 (0)
|
13.0
|
120.4 (0)
|
31.2
|
236 (0)
|
23 (0)
|
486
|
537
|
0.02
|
LKT1
|
1.5
|
52.9 (0)
|
20.6
|
31.2 (0)
|
13.0
|
126.2 (0)
|
26.4
|
239.1 (0)
|
20.6 (0)
|
489
|
555
|
0.02
|
LKT2
|
1.5
|
53.6 (0)
|
21.3
|
30.9 (0)
|
13.7
|
162.6 (1)
|
33.4
|
353.7 (0)
|
13.4 (0)
|
487
|
542
|
0.02
|
LKT2
|
5
|
53.3 (0)
|
21.0
|
30.5 (0)
|
13.5
|
145.6 (0)
|
30.4
|
356.2 (0)
|
13.5 (0)
|
487
|
542
|
0.02
|
LKT2
|
10
|
53 (0)
|
20.7
|
30 (0)
|
13.2
|
133.8 (0)
|
25.9
|
360 (0)
|
13.6 (0)
|
487
|
542
|
0.02
|
SPN1
|
1.5
|
52.9 (0)
|
20.3
|
31.4 (0)
|
12.6
|
134 (0)
|
18.1
|
167.2 (0)
|
22.6 (0)
|
486
|
539
|
0.02
|
HPN1
|
1.5
|
53 (0)
|
20.3
|
31.4 (0)
|
12.6
|
132.8 (1)
|
18.1
|
168.6 (0)
|
22.3 (0)
|
487
|
539
|
0.02
|
HPN2
|
1.5
|
53 (0)
|
20.3
|
31.4 (0)
|
12.6
|
135.7 (1)
|
18.1
|
168.9 (0)
|
23.3 (0)
|
487
|
539
|
0.02
|
HPN3
|
1.5
|
53.1 (0)
|
20.3
|
31.4 (0)
|
12.7
|
137.4 (1)
|
18.4
|
175.2 (0)
|
22.9 (0)
|
487
|
539
|
0.02
|
NWR1
|
1.5
|
54.9 (0)
|
21.1
|
33.4 (0)
|
13.3
|
130 (0)
|
18.2
|
256.6 (0)
|
29.7 (0)
|
484
|
535
|
0.02
|
HPN4
|
1.5
|
54.9 (0)
|
21.0
|
33.3 (0)
|
13.3
|
131.3 (0)
|
17.9
|
241.7 (0)
|
31.8 (0)
|
483
|
535
|
0.02
|
HPN5
|
1.5
|
53.3 (0)
|
20.9
|
31.8 (0)
|
13.2
|
124.9 (1)
|
20.3
|
281.6 (0)
|
28.2 (0)
|
492
|
541
|
0.02
|
HPN6
|
1.5
|
53.2 (0)
|
20.9
|
31.7 (0)
|
13.1
|
125.2 (1)
|
20.2
|
298.9 (0)
|
29.6 (0)
|
492
|
541
|
0.02
|
HPN7
|
1.5
|
54.2 (0)
|
20.9
|
32.4 (0)
|
13.2
|
119.7 (0)
|
19.1
|
311.1 (0)
|
35.5 (0)
|
486
|
537
|
0.02
|
NWR2
|
1.5
|
53.3 (0)
|
20.3
|
31.5 (0)
|
12.6
|
125.6 (0)
|
17.8
|
278.8 (0)
|
20.1 (0)
|
488
|
541
|
0.02
|
NWR3
|
1.5
|
53.3 (0)
|
20.3
|
31.5 (0)
|
12.6
|
125.6 (0)
|
17.8
|
277 (0)
|
20 (0)
|
488
|
541
|
0.02
|
NWR4
|
1.5
|
53.2 (0)
|
20.3
|
31.5 (0)
|
12.6
|
125.7 (0)
|
17.8
|
267.9 (0)
|
19.8 (0)
|
488
|
541
|
0.02
|
Note:
|
||||||||||||
Two new parameters under the proposed AQOs with a view to implementing in 2025 tentatively (i.e., 24-hour NO2 and 24-hour CO) have also been taken into consideration. The predicted cumulative 10th highest 24-hour averaged NO2, and highest 24-hour averaged CO concentrations at the ASRs during operation of the I∙PARK2 are presented in Table 3-11. The detailed result can be referred to Appendix 3M. According to Table 3-11, the predicted cumulative 10th highest 24-hour averaged concentration of NO2 and highest 24-hour averaged concentration of CO would comply with the proposed AQOs.
Table 3‑11 Predicted Cumulative 10th Highest 24-hour Averaged NO2 and Highest 24-hour Averaged CO Concentrations at Representative Air Sensitive Receivers [1]
Representative Air Sensitive
Receiver
|
Assessment Height (mAG)
|
10th Highest 24-hour
Average NO2 Conc. (mg/m3) [2]
|
Highest 24-hour Average CO Conc. (mg/m3)
|
New AQOs [3]
|
120 (9)
|
4,000
|
|
TPO1
|
39
|
55.6 (0)
|
457
|
TPO2
|
42
|
57.2 (0)
|
457
|
WXO1
|
1.5
|
55.4 (0)
|
458
|
TTC1
|
4
|
57.2 (0)
|
463
|
BPS1
|
1.5
|
62.3 (0)
|
458
|
BPS1
|
5
|
62 (0)
|
458
|
BPS1
|
10
|
61.5 (0)
|
458
|
LKT1
|
1.5
|
55.8 (0)
|
457
|
LKT2
|
1.5
|
69.1 (0)
|
455
|
LKT2
|
5
|
63.1 (0)
|
455
|
LKT2
|
10
|
52.6 (0)
|
455
|
SPN1
|
1.5
|
47.7 (0)
|
456
|
HPN1
|
1.5
|
48.2 (0)
|
456
|
HPN2
|
1.5
|
48.5 (0)
|
456
|
HPN3
|
1.5
|
48.8 (0)
|
456
|
NWR1
|
1.5
|
45.9 (0)
|
454
|
HPN4
|
1.5
|
46.6 (0)
|
454
|
HPN5
|
1.5
|
52.6 (0)
|
458
|
HPN6
|
1.5
|
52.5 (0)
|
458
|
HPN7
|
1.5
|
51.9 (0)
|
455
|
NWR2
|
1.5
|
44.5 (0)
|
461
|
NWR3
|
1.5
|
44.4 (0)
|
461
|
NWR4
|
1.5
|
44 (0)
|
461
|
Note:
|
|||
3.9.3 Operational Phase (Odour Impact)
The predicted cumulative odour impact to the ASRs during operation of the the I∙PARK2 with odour sources within 500 m assessment area are presented in Table 3-12. The detailed result is presented in Appendix 3M. According to the predicted results in Table 3-12, the odour concentrations at all representative ASRs would comply with the criterion of 5 OU/m3 based on an averaging time of 5 seconds. No adverse odour impact due to the operation of the the I∙PARK2 would be expected.
Contour plots at 4 m assessment height (i.e. the worst impact level) within AoIs were provided and presented in Appendix 3N. It is confirmed that no ASRs are identified within exceedance zones.
Table 3‑12 Predicted Odour Impact at Representative Air Sensitive Receivers
|
Representative Air Sensitive Receiver |
Assessment Height (mAG)
|
5 Second Average
Odour Unit (OU) per m3
|
EIAO-TM Criterion
|
5.0
|
|
TPO1
|
39
|
0.8 [1]
|
TPO2
|
42
|
0.6 [1]
|
WXO1
|
1.5
|
1.4
|
TTC1
|
4
|
1.8
|
BPS1
|
1.5
|
0.6
|
BPS1
|
5
|
0.6
|
BPS1
|
10
|
0.6
|
LKT1
|
1.5
|
0.5
|
LKT2
|
1.5
|
0.4
|
LKT2
|
5
|
0.4
|
LKT2
|
10
|
0.4
|
SPN1
|
1.5
|
0.5
|
HPN1
|
1.5
|
0.6
|
HPN2
|
1.5
|
0.6
|
HPN3
|
1.5
|
0.6
|
NWR1
|
1.5
|
0.8
|
HPN4
|
1.5
|
0.7
|
HPN5
|
1.5
|
0.8
|
HPN6
|
1.5
|
0.8
|
HPN7
|
1.5
|
0.7
|
NWR2
|
1.5
|
0.4
|
NWR3
|
1.5
|
0.4
|
NWR4
|
1.5
|
0.3
|
Note:
|
||
3.10.1
Construction
Phase
Air quality control measures stipulated in the Air Pollution Control (Construction Dust) Regulation will be implemented during the construction of the Project to control potential fugitive dust emissions. Standard construction practices for dust minimisation, including a number of practical measures such as regular water spraying, provision of vehicle wheel-washing and body washing facilities and shielding or covering with impervious sheet of stockpiled materials or exposed area when not in use, will be implemented to reduce air quality nuisance.
Site practices such as regular maintenance and checking of the diesel-driven PMEs will be adopted to avoid any black smoke emissions and to reduce gaseous and particulate emissions. Good site practices listed below should be carried out to further minimize construction air quality impact:
• Regular watering to reduce dust emissions from exposed site surfaces and unpaved roads, particularly during dry season.
• The working area of excavation or earth moving operation shall be sprayed with water or a dust suppression chemical immediately before, during and immediately after the operation so as to maintain the entire surface wet.
• Skip hoist for material transport shall be enclosed by impervious sheeting.
• Stockpile of dusty materials shall be either covered entirely by impervious sheeting; placed in an area sheltered on the top and the 3 sides; or sprayed with water or a dust suppression chemical so as to maintain the entire surface wet.
• Except for cement and pulverized fuel ash and for cases where the moisture content of the dusty materials is a matter of concern, dusty materials shall be sprayed with water or a dust suppression chemical immediately prior to any loading, unloading or transfer operation so as to maintain the dusty materials wet.
• Vehicle washing facilities including a high pressure water jet shall be provided at vehicle exit.
• Construction vehicle shall be washed to remove any dusty materials from its body and wheels immediately before leaving a construction site.
• Where a vehicle leaving a construction site is carrying a load of dusty materials, the load shall be covered entirely by clean impervious sheeting to ensure that the dusty materials do not leak from the vehicle.
• Provision of not less than 2.4m high hoarding from ground level along site boundary where adjoins a road, streets or other accessible to the public except for a site entrance or exit.
• Imposing speed control for vehicles on site haul roads.
• Conduct construction phase environmental monitoring and auditing to monitor the construction air quality impact and effectiveness of the air quality control measures.
Moreover, all constructional plant powered by diesel fuel and operating on public works construction sites must use ULSD. Timely provision of electricity to construction sites should be arranged as soon as practicable to minimize air quality impact arising from construction machinery. NRMMs shall be switched off when not in use to control the air quality impact from NRMMs. The use of hybrid, electric or clean-fuel NRMMs should also be adopted to further minimise the emissions from NRMMs if practicable. As stated in Section 3.2.10 of this report, exempted NRMM should also be avoided to be used at the construction site as far as practicable.
3.10.2
Operational
Phase
Air pollution control and stack monitoring system will be installed for the I∙PARK2 to ensure that the emissions from the stacks will meet the proposed target emission limits. The stack monitoring will follow the monitoring requirements in the prevailing guidance note on the best practicable means (BPM) for incinerators (municipal waste incineration) in Hong Kong as presented in Section 3.12.2 and EM&A Manual of this report. The IBA treatment and odorous facilities of this Project will be fully enclosed with negative pressure and all the air will be extracted from these facilities to the chamber for combustion and treated by flue gas treatment system before discharge. Misting system will be provided inside the IBA treatment plant as fugitive emission control. Air pollution control (including the installation of fabric filter) and emission monitoring will be implemented for the IBA treatment plant. Odour control system with odour removal efficiency of more than 95% shall be provided for treatment of odorous air before discharging into open atmosphere under the remote event of a shut-down or under the rare circumstances that the odorous air cannot be withdrawn into the combustion chamber of the incinerator for combustion. Besides, odour patrol will be carried out during operation of the Project as presented in Section 3.12.2 of this report to ensure that there would be no adverse odour impact arising from the Project. According to the assessment results, all the representative ASRs would comply with the AQO limit and thus no further mitigation measure would be required.
3.11.1
Construction
Phase
With the implementation of the good engineering practice and requirements as stipulated in the Air Pollution Control (Construction Dust) Regulation and the Air Pollution Control (Non-road Mobile Machinery) (Emission) Regulation, and construction dust monitoring to be carried out during the construction phase, no adverse residual air quality impact during construction phase of the Project is expected.
3.11.2
Operational
Phase
With the implementation of practicable air pollution control and stack monitoring system in accordance with the prevailing guidance note on the best practicable means (BPM) for incinerators (municipal waste incineration) in Hong Kong and monitoring of emissions from the IBA treatment facility, no adverse residual air quality and odour impacts during operation phase of the Project is expected.
3.12.1
Construction
Phase
With the implementation of the good engineering practice and requirements as stipulated in the Air Pollution Control (Construction Dust) Regulation and the Air Pollution Control (Non-road Mobile Machinery) (Emission) Regulation, adverse air quality impact during construction phase of the Project is not expected. Construction dust monitoring and environmental site inspections are recommended to be carried out during the construction phase to ensure the proper implementation of the air quality control measures and to ensure that there would be no adverse construction air quality impact at nearby ASRs arising from the Project. Details of the EM&A programme for air quality during the construction phase are provided in the EM&A Manual.
3.12.2
Operational
Phase
During the operation of the I∙PARK2, the major potential sources of air quality impacts would be the air emissions from the stacks of incineration process and the odour nuisance. Air pollution control and stack monitoring system in accordance with the prevailing guidance note on the best practicable means (BPM) for incinerators (municipal waste incineration) in Hong Kong, monitoring of emissions from the IBA treatment facility and EM&A Manual will be implemented to ensure that the emissions from the stack will meet the proposed target emission limits. Apart from stack monitoring, there are currently two existing air quality monitoring stations set up at T∙PARK and at the roof of the Tuen Mun Public Library which are sufficient to reflect any change in air quality in the vicinity of I∙PARK2 as well as in Tuen Mun during operation of the I∙PARK2. As there may be reclamation project in Lung Kwu Tan area, we will review the need for setting up additional air quality monitoring station in this location after the reclamation and development is confirmed.
For the IBA treatment plant, the monitoring requirements shall follow the EPD’s Guidance Note on the Best Practicable Means for Mineral Works (Stone Crushing Plant) BPM 11/1 (95). The monitoring frequency shall be agreed with the air pollution control authority according to the above guidance note. The monitoring locations shall include the exhaust points of the IBA treatment plant to demonstrate compliance with the requirements set out in the EIA report. Commissioning trial upon commissioning of the IBA treatment plant and further checking upon reaching the full handling capacity of the IBA treatment plant shall also be conducted to demonstrate the performance and capacity of the air pollution control measures and compliance with the emission rates assumed in the EIA report.
The odorous facilities of this Project will be fully enclosed with negative pressure and all the air will be extracted from these facilities to the chamber for combustion and treated by flue gas treatment system before discharge. Besides, odour patrol will be carried out during operation of the Project to ensure that there would be no adverse odour impact arising from the Project. Details of the EM&A programme for air quality during the operation phase are provided in the EM&A Manual of this report.
This Section of the EIA has assessed the potential air quality impacts associated with the construction and operation of the I∙PARK2. The purpose of the assessment is to evaluate the acceptability of the predicted impacts to air quality.
Potential air quality impacts arising from construction activities have been considered. With implementation of the good engineering practice and requirements as stipulated in the Air Pollution Control (Construction Dust) Regulation and the Air Pollution Control (Non-road Mobile Machinery) (Emission) Regulation, and construction dust monitoring to be carried out during the construction phase, no unacceptable impact on ASRs during construction phase of the Project is anticipated.
During the operation of the I∙PARK2, the potential sources of air quality impacts include the air emissions from the stacks of incineration process and the odour nuisance. Air pollution control and stack monitoring system in accordance with the prevailing guidance note on the best practicable means (BPM) for incinerators (municipal waste incineration) in Hong Kong, monitoring of emissions from the IBA treatment facility and EM&A will be implemented to ensure that the emissions from the stacks will meet the proposed target emission limits. The cumulative air quality and odour impact assessment results show that all the identified representative air sensitive receivers would comply with the EIAO-TM. Hence, adverse air quality impact arising from operation phase of the Project is not anticipated.
[1] Utilisation of waste
incineration bottom ash in Denmark - a contribution to
the circular economy (https://cirkulaer.dk/files/media/document/MSWI%20Bottom%20ash%20in%20Denmark%20-%20In%20English.pdf)
[2] Scottish
Environment Protection Agency, 2010, Odour guidance 2010, https://www.sepa.org.uk/media/154129/odour_guidance.pdf
[3] Final Air Quality Impact Assessment Report, Provision
of Consultancy Services for Air Quality Impact Assessment at West New
Territories Landfill Extension (WENTX), Environmental Protection Department.
June 2022.
[4] Environment Agency UK 2007. Review of methods for NO to NO2
conversion in plumes at short ranges (https://www.gov.uk/government/publications/review-of-methods-for-no-to-no2-conversion-in-plumes-at-short-ranges)
[5] Jenkin M E, 2004a. Analysis of sources and partitioning of
oxidant in the UK - Part 1: The NOx-dependence of
annual mean concentrations of nitrogen dioxide and ozone. Atmospheric
Environment, 38, 5117-5129.