5 Water Quality Impact
This section presents an assessment of the potential water quality impacts associated with the construction and operation of the Integrated Waste Management Facilities Phase 2 (I∙PARK2 or the Project). Suitable measures have been recommended, where necessary, to avoid/ minimize/ mitigate the potential impacts.
5.2.1 Assessment Area
In accordance with the EIA Study Brief, the water quality impact assessment shall cover area within 500 m from the boundary of the Project. It will also cover Deep Bay Water Control Zone (WCZ) and North Western WCZ defined under the Water Pollution Control Ordinance (WPCO) as well as Water Sensitive Receivers (WSRs) in the vicinity of the Project. The water quality impact assessment area shall be reviewed and extended to include other areas, if they are found also being affected by the Project during the course of this EIA study.
5.2.2 Water Sensitive Receivers
5.2.2.1 Inland Watercourses
Three major inland watercourses are identified within 500 m from the Project boundary, namely Water Channel (W1), Tsang Kok Stream (W2), Tsang Tsui Stream (W3). These inland watercourses are listed in Table 5-1 and their locations are shown in Figure 5.1.
Table 5-1 Inland Watercourses
|
ID |
Description |
|
|
Water
Channel |
W1 |
Man-made,
tidally influenced channel with concrete bed |
|
Tsang Kok Stream |
W2 |
Fully channelized by concrete |
|
Tsang Tsui Stream |
W3 |
Partially disturbed natural stream |
Tsang Tsui Stream (W3) is located to the south of the Project site. It has a natural stream bed but its banks have been disturbed and lined with geo-textile matting. Tsang Tsui Stream (W3) would discharge into Water Channel (W1), which is a man-made, tidally influenced concrete channel running along the southern Project site boundary.
The downstream section of Tsang Kok Stream is within the water quality impact assessment area of this Project. This section of Tsang Kok Stream (W2) is flowing through the existing West New Territories (WENT) Landfill site and is entirely channelized with concrete.
Both the Water Channel (W1) and Tsang Kok Stream (W2) would eventually drain into the tidal channel located to the east of T∙Park.
5.2.3 Marine Water Sensitive Receivers and Observation Points
Key marine WSRs that would potentially be affected by the Project and observation points in the area of interest are summarized in Table 5-2. Their locations are shown in Figure 5.2.
Table 5-2 Marine
Water Sensitive Receivers and Observation Points in the Vicinity of the Project
|
Description |
Name / Location |
ID |
Beneficial
Use / Type of
WSR |
Easting |
Northing |
|
|
Water
Sensitive Receivers |
||||||
|
Seawater
Intakes |
T∙Park |
S1 |
Water supply for desalination plant |
810475 |
831598 |
|
|
Black
Point Power Station |
S2a |
Cooling water supply |
808133 |
830203 |
||
|
S2b |
Cooling water supply |
808407 |
830288 |
|||
|
Castle
Peak Power Station |
S3 |
Cooling water supply |
809429 |
826080 |
||
|
Mudflat /
Seagrass / Horseshoe Crab |
Ha Pak
Nai |
E1 |
Ecological sensitive receiver |
812231 |
832329 |
|
|
Sheung
Pak Nai |
E2 |
Ecological sensitive receiver |
813179 |
833760 |
||
|
Marine Park |
Sha Chau
and Lung Kwu Chau (SCLKC) |
E3 (see Note
below) |
Ecological sensitive receiver |
806046 |
827890 |
|
|
Special Scientific Interest (SSSI) |
Pak Nai |
E4 |
Ecological sensitive receiver |
813102 |
834120 |
|
|
Traditional Oyster Production Area |
Tsim Bei Tsui to
Pak Nai |
F1 |
Fisheries sensitive receiver |
812668 |
833808 |
|
|
Mariculture Subzone |
Tsim Bei Tsui to Ha
Pak Nai |
F2 |
Fisheries sensitive receiver |
811698 |
833323 |
|
|
Important Spawning Ground of Commercial Fisheries
Resources |
North
Lantau |
F3 |
Fisheries sensitive receiver |
807036 |
827047 |
|
|
Secondary Contact Recreation Subzone |
Coastal water
of outer Deep Bay and North Western water |
- |
Secondary contact recreational water |
Not Applicable |
Not Applicable |
|
|
Observation Points |
||||||
|
Oyster
Culture Activities Outside Mariculture Subzone |
North of
Tsang Tsui |
O1 |
Mariculture |
810512 |
832411 |
|
|
O2 |
Mariculture |
809868 |
831720 |
|||
|
O3 |
Mariculture |
810603 |
831927 |
|||
Note: Indirect
water quality impact on artificial reefs located in
SCLKC Marine Park is assessed in the Fisheries Impact Assessment (Section 8)
by making reference to the water quality impact assessment results for E3.
The observation points (O1 to O3) represent the area of oyster activities granted or to be granted in Deep Bay (which overlaps with the traditional oyster production area and the mariculture subzone).
Recent dive surveys conducted under this EIA in 2023 and 2024 and another study in 2021[1] showed the absence or very low coverage of common and widespread corals along the artificial shores of Outer Deep Bay. Isolated patches of one single species of gorgonian coral Guaiagorgia sp. were found along the artificial seawall of Tsang Tsui Ash Lagoons (TTAL) with very low coverage (<1%). These isolated patches of small and unhealthy coral colonies are regarded as of low ecological value and are not considered as sensitive coral site. They are therefore not covered in this water quality impact assessment. Descriptions of ecological and fisheries sensitive receivers are separately presented in the Ecological Impact Assessment and Fisheries Impact Assessment of this EIA report.
Locations of the seawater intakes (S1, S2a, S2b and S3) have been confirmed with the corresponding seawater intake operators.
5.3.1 Environmental Impact Assessment Ordinance
The new Technical Memorandum on Environmental Impact Assessment Process (EIAO-TM) has been effective since 30 June 2023. It specifies the assessment method and criteria that need to be followed in EIA. The reference sections in EIAO-TM that are relevant to the water quality impact assessment include:
n Annex 6 Criteria for Evaluating Water Pollution.
n Annex 14 Guidelines for Assessment of Water Pollution.
5.3.2 Water Pollution Control Ordinance (WPCO)
The Water Pollution Control Ordinance (WPCO) provides the major statutory framework for the protection and control of water quality in Hong Kong. According to the WPCO and its subsidiary legislation, Hong Kong waters are divided into ten Water Control Zones (WCZ). Corresponding statements of Water Quality Objectives (WQO) are stipulated for different water regimes (marine waters, inland waters, bathing beaches subzones, secondary contact recreation subzones and fish culture subzones) in the WCZ based on their beneficial uses. With reference to the EIA Study Brief, the Study Area for this water quality impact assessment covers Deep Bay and North Western WCZs (see Figure 5.2). Their corresponding WQOs as extracted from the WPCO are presented in Table 5-3 and Table 5-4.
Table 5-3 Water
Quality Objectives for Deep Bay Water Control Zone
|
Parameters |
Water Quality Objectives |
Part or Parts of Zone |
|
A.
Aesthetic Appearance |
(a) Waste discharges
shall cause no objectionable odours or discolouration of the water. |
Whole Zone |
|
(b) Tarry residues,
floating wood, articles made of glass, plastic, rubber or of any other
substances should be absent. |
Whole Zone |
|
|
(c)
Mineral oil should not be visible on the surface.
Surfactants should not give rise to a lasting foam. |
Whole Zone |
|
|
(d) There should be
no recognisable sewage-derived debris. |
Whole Zone |
|
|
(e) Floating, submerged
and semi-submerged objects of a size likely to interfere with the free
movement of vessels, or cause damage to vessels, should be absent. |
Whole Zone |
|
|
(f)
Waste discharges shall not cause the water to
contain substances which settle to form objectionable deposits. |
Whole Zone |
|
|
B.
Bacteria |
(a) The level of Escherichia
coli (E. coli) should not exceed 610 per 100 millilitre (mL),
calculated as the geometric mean of all samples collected in one calendar
year. |
Secondary Contact Recreation
Subzones and Mariculture Subzones |
|
(b) The level of E.
coli should be zero per 100 mL, calculated as the running median of the
most recent 5 consecutive samples taken at intervals of between 7 and 21
days. |
Yuen Long & Kam Tin (Upper)
Subzone, Beas Subzone, Indus Subzone, Ganges Subzone and Water Gathering
Ground Subzones |
|
|
(c)
The level of E. coli should not exceed 1
000 per 100 mL, calculated as the running median of the most recent 5
consecutive samples taken at intervals of between 7 and 21 days. |
Yuen Long & Kam Tin
(Lower) Subzone and other inland waters |
|
|
(d) The level of E.
coli should not exceed 180 per 100 mL, calculated as the geometric mean
of all samples collected from March to October inclusive in one calendar
year. Samples should be taken at least 3 times in a calendar month at
intervals of between 3 and 14 days. |
Yung Long Bathing
Beach Subzone |
|
|
C.
Colour |
(a) Waste
discharges shall not cause the colour of water to exceed 30 Hazen units. |
Yuen Long & Kam Tin
(Upper) Subzone, Beas Subzone, Indus Subzone, Ganges Subzone and Water
Gathering Ground Subzones |
|
(b) Waste
discharges shall not cause the colour of water to exceed 50 Hazen units. |
Yuen Long & Kam Tin
(Lower) Subzone and other inland waters |
|
|
D.
Dissolved Oxygen (DO) |
(a) Waste
discharges shall not cause the level of DO to fall below 4 milligrams per
litre (mg/L) for 90% of the sampling occasions during the year; values should
be taken at 1 metre (m) below surface. |
Inner Marine Subzone excepting
Mariculture Subzone |
|
(b) Waste
discharges shall not cause the level of DO to fall below 4 mg/L for 90% of
the sampling occasions during the year; values should be calculated as water
column average (arithmetic mean of at least 2 measurements at 1 m below
surface and 1 m above seabed). In addition, the concentration of DO should
not be less than 2 mg/L within 2 m of the seabed for 90% of the sampling
occasions during the year. |
Outer Marine Subzone
excepting Mariculture Subzone |
|
|
(c) The DO level
should not be less than 5 mg/L for 90% of the sampling occasions during the
year; values should be taken at 1 m below surface. |
Mariculture Subzone |
|
|
(d) Waste
discharges shall not cause the level of DO to be less than 4 mg/L. |
Yuen Long & Kam Tin
(Upper and Lower) Subzones, Beas Subzone, Indus Subzone, Ganges Subzone,
Water Gathering Ground Subzones and other inland waters of the Zone |
|
|
E.
pH |
(a) The pH of the
water should be within the range of 6.5-8.5 units. In addition, waste
discharges shall not cause the natural pH range to be extended by more than
0.2 units. |
Marine waters excepting
Yung Long Bathing Beach Subzone |
|
(b) Waste
discharges shall not cause the pH of the water to exceed the range of 6.5-8.5
units. |
Yuen Long & Kam Tin
(Upper and Lower) Subzones, Beas Subzone, Indus Subzone, Ganges Subzone and
Water Gathering Ground Subzones |
|
|
(c)
The pH of the water should be within the range of
6.0-9.0 units. |
Other inland waters |
|
|
(d) The pH of the
water should be within the range of 6.0-9.0 units for 95% of samples. In
addition, waste discharges shall not cause the natural pH range to be
extended by more than 0.5 units. |
Yung Long Bathing
Beach Subzone |
|
|
F.
Temperature |
Waste discharges shall
not cause the natural daily temperature range to change by more than 2.0 oC. |
Whole Zone |
|
G.
Salinity |
Waste discharges shall
not cause the natural ambient salinity level to change by more than 10%. |
Whole Zone |
|
H.
Suspended Solids (SS) |
(a) Waste
discharges shall neither cause the natural ambient level to be raised by 30%
nor give rise to accumulation of SS which may adversely affect aquatic
communities. |
Marine waters |
|
(b) Waste
discharges shall not cause the annual median of SS to exceed 20 mg/L |
Yuen Long & Kam Tin
(Upper and Lower) Subzones, Beas Subzone, Ganges Subzone, Indus Subzone,
Water Gathering Ground Subzones and other inland waters |
|
|
I.
Ammonia |
The un-ionized ammoniacal
nitrogen level should not be more than 0.021 mg/L, calculated as the annual
average (arithmetic mean). |
Whole Zone |
|
J.
Nutrients |
(a) Nutrients shall
not be present in quantities sufficient to cause excessive or nuisance growth
of algae or other aquatic plants. |
Inner and Outer Marine
Subzones |
|
(b) Without
limiting the generality of objective (a) above, the level of inorganic
nitrogen should not exceed 0.7 mg/L, expressed as annual mean. |
Inner Marine Subzone |
|
|
(c) Without
limiting the generality of objective (a) above, the level of inorganic
nitrogen should not exceed 0.5 mg/L, expressed as annual water column average
(arithmetic mean of at least 2 measurements at 1 m below surface and 1 m
above seabed). |
Outer Marine Subzone |
|
|
K.
5-Day Biochemical Oxygen Demand (BOD5) |
(a) Waste
discharges shall not cause the BOD5 to exceed 3 mg/L |
Yuen Long & Kam Tin
(Upper) Subzone, Beas Subzone, Indus Subzone, Ganges Subzone and Water
Gathering Ground Subzones |
|
(b) Waste
discharges shall not cause the BOD5 to exceed 5 mg/L |
Yuen Long & Kam Tin (Lower)
Subzone and other inland waters |
|
|
L.
Chemical Oxygen Demand (COD) |
(a) Waste
discharges shall not cause the COD to exceed 15 mg/L |
Yuen Long & Kam Tin
(Upper) Subzone, Beas Subzone, Indus Subzone, Ganges Subzone and Water
Gathering Ground Subzones |
|
(b) Waste
discharges shall not cause the COD to exceed 30 mg/L |
Yuen Long & Kam Tin
(Lower) Subzone and other inland waters |
|
|
M. Toxins |
(a) Waste
discharges shall not cause the toxins in water to attain such levels as to
produce significant toxic, carcinogenic, mutagenic or teratogenic effects in
humans, fish or any other aquatic organisms, with due regard to biologically
cumulative effects in food chains and to toxicant interactions with each
other |
Whole Zone |
|
(b) Waste
discharges shall not cause a risk to any beneficial use of the aquatic
environment |
Whole Zone |
|
|
N.
Phenol |
Phenols shall not to be
present in such quantities as to produce a specific odour, or in
concentration greater than 0.05 mg/L as C6 H5OH |
Yung Long Bathing
Beach Subzone |
|
O.
Turbidity |
Waste discharges shall no
reduce light transmission substantially from the normal level |
Yung Long Bathing
Beach Subzone |
Source:
Statement of Water Quality Objectives (Deep Bay Water Control Zone)
Table 5-4 Water
Quality Objectives for North Western Water Control Zone
|
Parameters |
Objectives |
Part or Parts of Zone |
|
A. Aesthetic
Appearance |
(a) Waste
discharges shall cause no objectionable odours or discolouration of the
water. |
Whole Zone |
|
(b) Tarry residues,
floating wood, articles made of glass, plastic, rubber or of any other
substances should be absent. |
Whole Zone |
|
|
(c)
Mineral oil should not be visible on the surface.
Surfactants should not give rise to a lasting foam. |
Whole Zone |
|
|
(d) There should be
no recognisable sewage-derived debris. |
Whole Zone |
|
|
(e) Floating,
submerged and semi-submerged objects of a size likely to interfere with the
free movement of vessels, or cause damage to vessels, should be absent. |
Whole Zone |
|
|
(f)
Waste discharges shall not cause the water to
contain substances which settle to form objectionable deposits. |
Whole Zone |
|
|
B.
Bacteria |
(a) The level of Escherichia
coli (E. coli) should not exceed 610 per 100 millilitre (mL),
calculated as the geometric mean of all samples collected in a calendar year. |
Secondary Contact Recreation Subzones |
|
(b) The level of E.
coli should be less than 1 per 100 mL, calculated as the running median
of the most recent 5 consecutive samples taken at intervals of between 7 and
21 days. |
Tuen Mun (A) and Tuen Mun (B) Subzones and Water
Gathering Ground Subzones |
|
|
(c)
The level of E. coli should not exceed 1
000 per 100 mL, calculated as the running median of the most recent 5
consecutive samples taken at intervals of between 7 and 21 days. |
Tuen Mun (C) Subzone and other inland waters |
|
|
(d) The level of E.
coli should not exceed 180 per 100 mL, calculated as the geometric mean of
all samples collected from March to October inclusive. Samples should be
taken at least 3 times in one calendar month at intervals of between 3 and 14
days. |
Bathing Beach Subzones |
|
|
C.
Colour |
(a) Waste
discharges shall not cause the colour of water to exceed 30 Hazen units. |
Tuen Mun (A) and Tuen Mun (B) Subzones and Water
Gathering Ground Subzones |
|
(b) Waste
discharges shall not cause the colour of water to exceed 50 Hazen units. |
Tuen Mun (C) Subzone and other inland waters |
|
|
D. Dissolved Oxygen (DO) |
(a) Waste
discharges shall not cause the level of DO to fall below 4 milligrams per
litre (mg/L) for 90% of the sampling occasions during the whole year; values should be calculated as water column average (arithmetic mean
of at least 3 measurements at 1 m below surface and 1 m above seabed). In addition, the concentration of DO should not be less than 2 mg/L
within 2 m of the seabed for 90% of the sampling occasions during the whole
year. |
Marine waters |
|
(b) Waste
discharges shall not cause the level of DO to fall below 4 mg/L. |
Tuen Mun (A), Tuen Mun (B) and Tuen Mun (C)
Subzones, Water Gathering Ground Subzones and other inland waters |
|
|
E.
pH |
(a) The pH of the
water should be within the range of 6.5-8.5 units. In addition, waste
discharges shall not cause the natural pH range to be extended by more than
0.2 unit. |
Marine waters excepting Bathing Beach Subzones |
|
(b) Waste discharges
shall not cause the pH of the water to exceed the range of 6.5-8.5 units. |
Tuen Mun (A), Tuen Mun (B) and Tuen Mun (C) Subzones
and Water Gathering Ground Subzones |
|
|
(c)
The pH of the water should be within the range of
6.0-9.0 units. |
Other inland waters |
|
|
(d) The pH of the
water should be within the range of 6.0-9.0 units for 95% of samples
collected during the whole year. In addition, waste discharges shall not
cause the natural pH range to be extended by more than 0.5 unit. |
Bathing Beach Subzones |
|
|
F.
Temperature |
Waste discharges shall not cause the natural daily
temperature range to change by more than 2 oC |
Whole Zone |
|
G. Salinity |
Waste discharges shall
not cause the natural ambient salinity level to change by more than 10% |
Whole Zone |
|
H. Suspended Solids (SS) |
(a) Waste discharges
shall neither cause the natural ambient level to be raised by more than 30%
nor give rise to accumulation of suspended solids which may adversely affect
aquatic communities. |
Marine waters |
|
(b) Waste
discharges shall not cause the annual median of SS to exceed 20 mg/L. |
Tuen Mun (A), Tuen Mun (B) and Tuen Mun (C) Subzones
and Water Gathering Ground Subzones |
|
|
(c) Waste
discharges shall not cause the annual median of SS to exceed 25 mg/L. |
Other inland waters |
|
|
I.
Ammonia |
The un-ionized ammoniacal nitrogen level should not
be more than 0.021 mg/L, calculated as the annual average (arithmetic mean). |
Whole Zone |
|
J.
Nutrients |
(a) Nutrients shall
not be present in quantities sufficient to cause excessive or nuisance growth
of algae or other aquatic plants. |
Marine waters |
|
(b) Without
limiting the generality of objective (a) above, the level of inorganic
nitrogen should not exceed 0.3 mg/L, expressed as annual water column average
(arithmetic mean of at least 3 measurements at 1 m below surface, mid-depth
and 1 m above seabed). |
Castle Peak Bay Subzone |
|
|
(c) Without
limiting the generality of objective (a) above, the level of inorganic
nitrogen should not exceed 0.5 mg/L, expressed as annual water column average
(arithmetic mean of at least 3 measurements at 1 m below surface and 1 m
above seabed). |
Marine waters excepting Castle
Peak Bay Subzone |
|
|
K.
5-Day Biochemical Oxygen Demand (BOD5) |
(a) Waste discharges
shall not cause the BOD5 to exceed 3 mg/L |
Tuen Mun (A), Tuen Mun (B) and Tuen Mun (C) Subzones
and Water Gathering Ground Subzones |
|
(b) Waste
discharges shall not cause the BOD5 to exceed 5 mg/L |
Other inland waters |
|
|
L.
Chemical Oxygen Demand (COD) |
(a) Waste
discharges shall not cause the COD to exceed 15 mg/L. |
Tuen Mun (A), Tuen Mun (B) and Tuen Mun (C) Subzones
and Water Gathering Ground Subzones |
|
(b) Waste
discharges shall not cause the COD to exceed 30 mg/L. |
Other inland waters |
|
|
M. Toxins |
(a) Waste discharges
shall not cause the toxins in water to attain such levels as to produce
significant toxic, carcinogenic, mutagenic or teratogenic effects in humans,
fish or any other aquatic organisms, with due regard to biologically
cumulative effects in food chains and to toxicant interactions with each
other. |
Whole Zone |
|
(b) Waste
discharges shall not cause a risk to any beneficial use of the aquatic
environment. |
Whole Zone |
|
|
N. Phenol |
Phenols shall not be present in such quantities as
to produce a specific odour, or in concentration greater than 0.05 mg/L as C6 H5OH |
Bathing Beach Subzones |
|
O. Turbidity |
Waste discharges shall not reduce light transmission
substantially from the normal level |
Bathing Beach Subzones |
Source: Statement of Water Quality Objectives (North
Western Water Control Zone)
5.3.3 Technical Memorandum on Effluent Discharge Standard
Besides setting the WQOs, the WPCO controls effluent discharging into the WCZs through a licensing system. Guidance on the permissible effluent discharges based on the type of receiving waters (foul sewers, stormwater drains, inland and coastal waters) is provided in the Technical Memorandum on Standards for Effluents Discharged into Drainage and Sewerage Systems, Inland and Coastal Waters (TM-DSS). The limits given in the TM-DSS cover the physical, chemical and microbial quality of effluents. Any effluent discharge during the construction and operational stages should comply with the relevant standards as stipulated in the TM-DSS. According to Section 9 of the TM-DSS, no new effluent will be allowed: (1) within 200m of the seaward boundaries of a marine fish culture zone or a site of special scientific interest (SSSI), and within 100m of the landward boundaries; and (2) within 100m of a seawater intake point.
5.3.4 Professional Persons Environmental Consultative Committee
Practice Notes
The Professional Persons Environmental Consultative Committee Practice Note on Construction Site Drainage (ProPECC PN 2/23) provides good practice guidelines for dealing with various types of discharge from a construction site. These include surface runoff, groundwater, boring and drilling water, bentonite slurry, water for testing and sterilisation of water retaining structures and water pipes, wastewater from building construction, acid cleaning, etching and pickling wastewater, and wastewater from site facilities. Practices outlined in the ProPECC PN 2/23 should be followed where applicable during the construction phase to minimize the water quality impact due to construction site drainage.
The Professional Persons Environmental Consultative Committee Practice Note on Drainage Plans subject to Comments by Environmental Protection Department (ProPECC PN 1/23) provides guidelines and practices for handling, treatment and disposal of various effluent discharges to stormwater drains and foul sewers during the operation phase.
The relevant practices outlined in ProPECC PN 2/23 and ProPECC PN 1/23 should be implemented as far as practicable during construction phase and operational phase respectively to ensure proper handling, treatment and disposal of various discharges from the Project.
5.3.5
Sediment Deposition Criterion for
Benthic Ecology
Potential impacts on benthic organisms (e.g. seagrass) may arise through excessive sediment deposition. The magnitude of the potential impacts is assessed based on the predicted sedimentation rate.
Deep Bay and North Western WCZs are located in the Pearl River Estuary where the sediment regime is more dynamic than in other parts of Hong Kong’s coastal waters. Typical benthic communities in the estuarine environment of Deep Bay and North Western WCZs are expected to be more tolerant to sediment deposition. The sediment deposition criterion of 100 g/m2/day is adopted for this EIA study, following the approach used in other recent EIA projects such as the EIA for Route 11 (Section between Yuen Long and North Lantau) (AEIAR-255/2023).
5.3.6 Total Residual Chlorine Criterion
Chlorine is commonly used as an anti-fouling agent for seawater intake and outfall systems. Residual chlorine discharging to the receiving water is potentially harmful to marine organisms. Environmental Protection Department (EPD) had commissioned an ecotoxicity study [2] on Total Residual Chlorine (TRC) using local species. The lowest No Observable Effect Concentration (NOEC) value from that study (based on a 4-day average chronic toxicity exposure) was 0.02 mg/L.
The United States Environmental Protection Agency (USEPA) derived a chronic TRC limit of 0.0075 mg/L (as 4-day average) and an acute TRC limit of 0.013 mg/L (as one-hour average) to protect saltwater aquatic life. The USEPA saltwater TRC limits are considered to be more applicable to the actual aquatic environment in the areas and therefore adopted as the assessment criteria for this EIA study.
5.3.7 Seawater Intake Water Quality Criteria
5.3.7.1 T∙Park
The design water quality for the seawater intake of T∙Park has been obtained from T∙Park. Selected parameters that are relevant to this EIA are tabulated in Table 5-5.
Table 5-5 Design Intake Water Quality for T∙Park
|
Parameters |
Unit |
Upper Bound of Design Water Quality |
|
Temperature |
oC |
31 |
|
Total Suspended Solids
(TSS) |
mg / L |
130 |
Remark: The design water quality for seawater intake of T∙Park
includes around 20 parameters, e.g. temperature, TSS, and some metals like
iron, magnesium and calcium. The Project would mainly affect 2 design
parameters, namely temperature and TSS, which are therefore considered in the
assessment. The effect on the remaining design parameters of concern induced by
the Project is expected to be negligible.
5.3.7.2 Power Stations
Based on the latest information obtained from the intake operators under this EIA study, the absolute Suspended Solids (SS) limit for the seawater intakes of Black Point Power Station (BBPS) is 764 mg/L whereas the tolerance SS increase at the intake points is 700 mg/L. On the other hand, no specific water quality criteria are available for the seawater intake of Castle Peak Power Station (CPPS) as advised by the intake operator (see Appendix 5A).
5.3.8 Water Quality Criteria for Ecological and Fisheries Sensitive
Receivers
The existing ecological and
fisheries resources in the assessment area are subject to the influences of the
Pearl River discharges with relatively high Suspended Solids (SS). They are
expected to tolerate a wider range of environmental conditions as compared to
those receivers located outside the Pearl River Estuary. The WQOs established
under the WPCO for SS, temperature and salinity; the sediment deposition
criterion for benthic ecology; and the water quality criteria for TRC as
presented in the sub-sections above are considered sufficient for protection of
the identified ecological and fisheries resources including the traditional
oyster production area.
5.4.1
Inland Water
There is one EPD’s routine river water quality monitoring station (DB8) located at Tsang Kok Stream. Location of monitoring station (DB8) is shown in Figure 5.1. A summary of the monitoring data as extracted from the EPD’s publication “River Water quality in Hong Kong in 2022” is presented in Table 5-6.
Table 5-6 River Water Quality Monitoring Data Collected by EPD in 2022
|
Parameter |
Unit |
Tsang Kok Stream (DB8) |
Summary of WPCO WQOs |
|
Dissolved Oxygen (DO) |
mg/L |
8.7 (7.2-10.5) |
≥4 (minimum value) |
|
pH |
pH
unit |
7.4 (7.2-7.9) |
6-9 |
|
Suspended Solids (SS) |
mg/L |
4.7 (1.5-24.0) |
≤20 (annual median) |
|
5-day Biochemical Oxygen
Demand (BOD5) |
mg/L |
0.5 (<0.1-4.1) |
≤5 (maximum value) |
|
Chemical Oxygen Demand
(COD) |
mg/L |
5 (<2-25) |
≤30 (maximum value) |
|
Oil & Grease |
mg/L |
<0.5 (<0.5-<0.5) |
N/A |
|
Faecal coliforms |
cfu/100mL |
4 000 (400-31 000) |
N/A |
|
E. coli |
cfu/100mL |
340 (120-3 700) |
≤1 000 (median of 5 consecutive samples) |
|
Ammonia-nitrogen (NH3-N) |
mg/L |
0.069 (0.031-8.700) |
N/A |
|
Nitrate-nitrogen (NO3-N) |
mg/L |
1.800 (0.520-2.900) |
N/A |
|
Total Kjeldahl Nitrogen
(TKN) |
mg/L |
0.34 (0.17-12.00) |
N/A |
|
Orthophosphate (PO4-P) |
mg/L |
0.008 (<0.002-0.019) |
N/A |
|
Total phosphorus (TP) |
mg/L |
<0.02 (<0.02-0.06) |
N/A |
|
Sulphide |
mg/L |
<0.02 (<0.02-0.02) |
N/A |
|
Aluminium |
mg/L |
<50 (<50-<50) |
N/A |
|
Cadmium |
mg/L |
<0.1 (<0.1-<0.1) |
N/A |
|
Chromium |
mg/L |
<1 (<1-<1) |
N/A |
|
Copper |
mg/L |
<1 (<1-4) |
N/A |
|
Lead |
mg/L |
<1 (<1-<1) |
N/A |
|
Zinc |
mg/L |
<10 (<10-10) |
N/A |
|
Flow |
m3/s |
0.018 (0.002-0.142) |
N/A |
Notes:
1. Data source: River Water Quality in Hong Kong in 2022.
2. Data presented are in annual medians of monthly samples,
except those for faecal coliforms and E. coli which are in
annual geometric means.
3. Figures in brackets are annual ranges.
4. N/A: Not available
Tsang Kok Stream had a “Excellent” grading in 2022. The WQO compliance rate for the monitoring station at Tsang Kok Stream was 100% in 2022.
There are no available water quality monitoring data for Tsang Tsui Stream (W3) and Water Channel (W1) as shown in Figure 5.1. The catchment areas of these two watercourses are mainly rural in nature. Majority of their catchment areas comprises natural topography with no significant water pollution source.
5.4.2
Marine Water
5.4.2.1 EPD Monitoring Data
The EPD water quality monitoring stations in the Outer Deep Bay WCZ (DM4 and DM5) and Urmston Road of the North Western WCZ (NM5) are the nearest monitoring stations to the Project site (see Figure 5.2). A summary of the relevant monitoring data as extracted from the EPD’s publication “Marine Water quality in Hong Kong in 2022” is presented in Table 5-7.
Table 5-7 Marine
Water Quality Monitoring Data Collected by EPD in
2022
|
Parameter |
Outer Deep Bay |
Urmston Road |
Summary of WPCO WQOs |
||
|
DM4 |
DM5 |
NM5 |
|||
|
Temperature (oC) |
25.0 (18.5-30.6) |
24.5 (18.4-29.9) |
24.5 (15.9-29.4) |
≤ 2 oC change from natural daily range |
|
|
Salinity |
23.2 (8.0-31.2) |
25.2 (9.0-32.7) |
27.3 (19.7-33.1) |
±10% change from natural
ambient level |
|
|
Dissolved Oxygen (DO) (mg/L) |
Depth average |
5.9 (4.7-7.0) |
5.8 (5.0-6.7) |
5.5 (4.1-6.8) |
≥4 mg/L for 90% of
the samples during the year |
|
Bottom |
5.7 (4.1-7.4) |
5.8 (4.7-7.2) |
5.2 (3.5-7.0) |
≥2 mg/L for 90% of the
samples during the year |
|
|
Dissolved Oxygen (DO) (%
Saturation) |
Depth average |
80 (67-94) |
80 (71-90) |
77 (56-86) |
N/A |
|
Bottom |
79 (57-99) |
80 (67-92) |
73 (51-87) |
N/A |
|
|
pH |
7.5 (7.1-7.9) |
7.6 (7.1-8.0) |
7.6 (7.1-8.0) |
6.5-8.5 (±0.2 change from
natural range) |
|
|
Secchi disc Depth (m) |
1.9 (1.2-2.9) |
1.9 (1.7-2.7) |
1.9 (1.2-2.7) |
N/A |
|
|
Turbidity (NTU) |
32.3 (5.4-144.0) |
23.4 (4.0-78.1) |
32.8 (4.1-120.0) |
N/A |
|
|
Suspended Solids (mg/L) |
7.4 (3.2-14.0) |
5.2 (3.3-9.7) |
10.4 (2.6-30.0) |
≤ 30% increase from natural
ambient level |
|
|
5-day Biochemical Oxygen
Demand (BOD5) (mg/L) |
0.7 (<0.1-3.3) |
0.9 (0.1-2.9) |
0.5 (<0.1-0.9) |
N/A |
|
|
Ammonia
Nitrogen (NH3-N) (mg/L) |
0.127 (0.038-0.200) |
0.098 (0.009-0.190) |
0.094 (0.034-0.177) |
N/A |
|
|
Unionised Ammonia (UIA)
(mg/L) |
0.002 (<0.001-0.007) |
0.002 (<0.001-0.006) |
0.002 (<0.001-0.005) |
≤0.021 mg/L (annual mean) |
|
|
Nitrite Nitrogen (NO2-N)
(mg/L) |
0.061 (0.033-0.130) |
0.057 (0.020-0.137) |
0.057 (0.011-0.120) |
N/A |
|
|
Nitrate Nitrogen (NO3-N)
(mg/L) |
0.630 (0.300-1.200) |
0.558 (0.140-1.270) |
0.356 (0.066-0.917) |
N/A |
|
|
Total Inorganic Nitrogen
(TIN) (mg/L) |
0.82 (0.43-1.43) |
0.71 (0.28-1.41) |
0.51 (0.20-1.02) |
≤0.5 mg/L (annual mean) |
|
|
Total Kjeldahl Nitrogen
(TKN) (mg/L) |
0.35 (0.18-0.64) |
0.31 (0.12-0.88) |
0.39 (0.13-1.15) |
N/A |
|
|
Total Nitrogen (TN)
(mg/L) |
1.04 (0.56-.61) |
0.93 (0.44-1.56) |
0.81 (0.42-1.23) |
N/A |
|
|
Orthophosphate Phosphorus
(PO4-P) (mg/L) |
0.029 (<0.002-.073) |
0.016 (<0.002-0.038) |
0.016 (0.005
- 0.038) |
N/A |
|
|
Total Phosphorus (TP)
(mg/L) |
0.09 (0.04 -
0.13) |
0.06 (0.03-0.10) |
0.06 (0.04 -
0.10) |
N/A |
|
|
Silica (as SiO2)
(mg/L) |
3.57 (0.99-.50) |
3.00 (0.86-8.10) |
2.24 (0.72-5.47) |
N/A |
|
|
Chlorophyll-a ( g/L) |
1.9 (0.5-5.2) |
2.0 (0.5-5.9) |
1.4 (0.5-3.4) |
N/A |
|
|
E. coli (cfu/100
mL) |
17 (<1-250) |
20 (2-940) |
41 (4-770) |
N/A |
|
|
Faecal Coliforms (cfu/100
mL) |
35 (1-760) |
43 (2-1900) |
89 (8-1400) |
N/A |
|
Notes:
1. Data source: Marine Water Quality in Hong Kong in 2022
2. Except as specified, data presented are depth-averaged values
calculated by taking the means of three depths: Surface, mid-depth, bottom.
3. Data presented are annual arithmetic means of depth-averaged
results except for E. coli and faecal coliforms that are
annual geometric means.
4. Data in brackets indicate the ranges.
5. N/A: Not available.
In 2022, the water quality in outer Deep Bay and Urmston Road complied with the WQOs for Dissolved Oxygen (DO), pH and Unionized Ammonia (UIA) but exceeded the WQO for Total Inorganic Nitrogen (TIN) due to the influence of high background level in the Pearl River Estuary.
The long-term water quality monitoring data collected in outer Deep Bay and North Western waters [3] also showed exceedances of the TIN WQOs. The measured TIN levels in outer Deep Bay and North Western waters steadily increased over the period from 1986 to early 2000s. A noticeable decreasing trends of measured TIN levels from mid-2000s to 2022 has been seen.
5.4.2.2 Decommissioning of West Portion of the Middle Ash Lagoon
Decommissioning of West Portion of the Middle Ash Lagoon was completed on 24 May 2017. A post-construction marine water monitoring programme was conducted for a 4-week period from 29 May to 23 June 2017 [4]. Heavy metals including aluminium, chromium and cadmium, which have the greatest tendency to leach from the pulverised fuel ash (PFA) into the seawater solution from past laboratory leaching trials [5], [6], were monitored. Monitoring locations include two impact stations located in the vicinity of the TTAL and two control stations in the outer marine water of Deep Bay. During the post-construction monitoring period, there were no construction works undertaken at the ash lagoons with no disturbance to the PFA. These monitoring data are best available information to represent the baseline metal concentrations near the Project site. The relevant monitoring data are summarized in Table 5-8. Locations of the monitoring stations (M1, M2, C2 and C3) are shown in Figure 5.1.
Table 5-8 Metal Concentrations
Measured Near the Project Site in 2017
|
Date |
Cadmium (mg/L) |
Chromium (mg/L) |
Aluminium (mg/L) |
|||
|
M1 and
M2 in Vicinity of TTAL |
C2 and C3 in Outer
Marine Water |
M1 and M2 in Vicinity of
TTAL |
C2 and C3 in Outer
Marine Water |
M1 and M2 in Vicinity of
TTAL |
C2 and C3 in Outer
Marine Water |
|
|
29 May 2017 |
<0.5 |
<0.5 |
<1 |
<1 |
<20 |
<20 |
|
31 May 2017 |
<0.5 |
<0.5 |
<1 |
<1 |
<20 |
<20 |
|
2 Jun 2017 |
<0.5 |
<0.5 |
<1 |
<1 |
<20 |
<20 |
|
5 Jun 2017 |
<0.5 |
<0.5 |
<1 |
<1 |
<20 |
<20 |
|
7 Jun 2017 |
<0.5 |
<0.5 |
<1 |
<1 |
<20 |
<20 |
|
9 Jun 2017 |
<0.5 |
<0.5 |
<1 |
<1 |
<20 |
<20 |
|
12 Jun 207 |
<0.5 |
<0.5 |
<1 |
<1 |
<20 |
<20 |
|
14 Jun 2017 |
<0.5 |
<0.5 |
<1 |
<1 |
<20 |
<20 |
|
16 Jun 2017 |
0.63-2.45 |
0.85-2.85 |
<1 |
<1 |
<20 |
<20 |
|
19 Jun 2017 |
<0.5 |
<0.5 |
<1 |
<1 |
<20 |
<20 |
|
21 Jun 2017 |
1.40-2.95 |
1.75 - 2.80 |
<1 |
<1 |
<20 |
<20 |
|
23 Jun 2017 |
<0.5 |
<0.5 |
<1 |
<1 |
<20 |
<20 |
Note: Bolded values - measured concentrations are above the detection limit.
Most of the metal concentrations measured near the ash lagoons were below the detection limits. The measured cadmium concentrations were above the detection limit at two locations (M1 and M2) near the ash lagoons on two monitoring dates. The same degree of cadmium concentrations was also observed in the outer marine water (C2 and C3) on the same dates. The increase in cadmium concentrations on the two monitoring dates could be due to other background sources in Deep Bay. The monitoring data showed no evidence of PFA leachate release from the ash lagoons. Dispersion of the PFA leachate across the Deep Bay water was also not observed.
5.5.1 Construction Phase
5.5.1.1 Introduction
Potential sources of water
quality impact associated with the Project during the construction phase
include:
n Construction site runoff and dust suppression sprays.
n Wastewater from general land-based construction activities.
n General refuse.
n Accidental chemical spillage.
n Sewage effluent from construction workforce.
n Seawall Modification and Construction of permanent berthing facility.
n Construction of seawater intake and outfall.
n Release of Pulverized Fuel Ash (PFA) leachate from ash lagoon.
5.5.1.2 Construction Site Runoff and Dust Suppression Sprays
Runoff and erosion from
exposed soil surfaces and stockpiles of the construction site may contain
increased loads of sediments. Water spraying would be an effective measure for dust
suppression but the spent water could be high in Suspended Solids (SS) and
turbidity. Uncontrolled discharge of construction site runoff and spent
effluent generated from dust suppression spraying would potentially increase
the SS and turbidity level in the nearby water environment.
Wastewater may also be
generated from the rain washing down of cement and other grouting materials.
These wash waters are turbid and alkaline materials. Uncontrolled release of
these materials may increase the SS levels and raise the pH level in the nearby
water bodies.
5.5.1.3 Wastewater from General Land-based Construction Activities
Wastewater from cleaning and
polishing, effluent from foundation piling as well as the equipment / wheel
washing water may contain high levels of SS. Uncontrolled release of these
types of wastewater may increase the SS level in WSRs.
5.5.1.4 General Refuse
Construction works would
generate debris and rubbish such as packaging and refuse. Improper rubbish and
refuse disposal could lead to degradation of aesthetic appearance and water
quality of the receiving waters.
5.5.1.5 Accidental Chemical Spillage
Variety of chemicals would
be used for carrying out construction activities. These chemicals may include
petroleum products, spent lubrication oil, grease, mineral oil and solvent.
Fuel, oil and lubricants may be used for maintenance of construction vehicles,
machinery and equipment. Accidental leakage or spillage of these chemicals may
infiltrate into the surface soil layer, or runoff into nearby water bodies,
increasing their hydrocarbon levels.
5.5.1.6 Sewage Effluent from Construction Workforce
Domestic sewage would be
generated from the workforce during the construction phase. Discharge of sewage
effluent may increase the organic pollution, ammonia and bacterial levels in
the receiving waters.
5.5.1.7 Seawall Modification and Construction of Permanent Berthing Facility
The existing artificial
seawall to the north and west of the Project site will be modified for
construction of berthing facility and / or seawater outfall to support
operation of I∙PARK2. The berthing facility
for I∙PARK2 are proposed for
marine delivery of municipal solid waste (MSW) and incinerator ash.
Modification of the existing seawall would also be required for the proposed
seawater outfalls and the associated pipeworks
associated with the once-through seawall cooling system as described in Section
5.5.2.2.
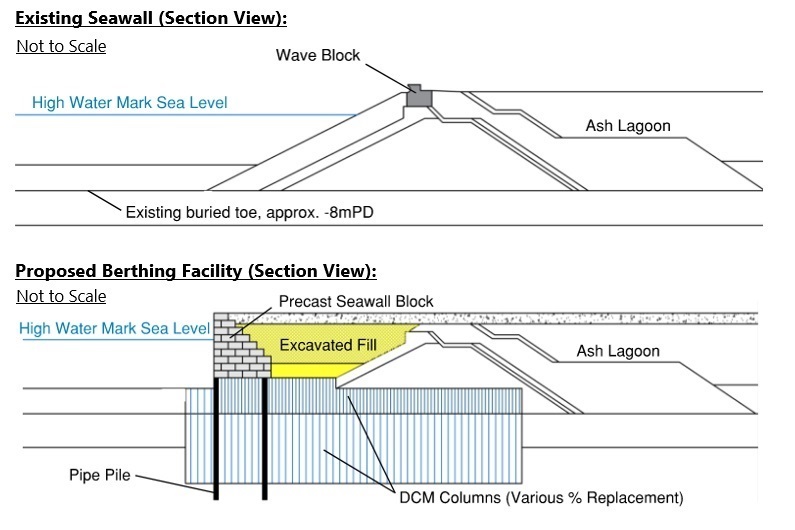
Marine construction will be carried out for seawall modification /construction of the proposed berthing facility. The non-dredged method, namely Deep Cement Mixing (DCM), will be adopted for construction of the foundation for the proposed seawall modification /berthing facility . The DCM involves injecting controlled volumes of cement into the underlying materials whilst simultaneously mixing the cement with the in-situ materials to improve their strength. Prior to installation of the DCM columns, the existing rock fill on the outer seawall would be removed. Sand blanket would then be laid across the DCM works area before commencement of the DCM operation. After completion of the DCM operation, precast concrete blocks would be placed on top of the DCM columns to form a new seawall along the Middle and West Ash Lagoons. Any further filling work for the proposed seawall modification / berthing facility would be land-based and conducted behind the modified seawall.
Exhibit
5‑1 Typical Arrangement of Berthing
Facility / Seawall Modification Work
Potential water quality
impact associated with the DCM works may include sediment loss and accidental
discharge of cement slurry during the DCM operation, which may increase the SS
and pH levels in the marine water. Thermal impact may also be induced from the
possible heat dissipation from the exothermic process of DCM.
Release of fines may also
occur during the sand blanket laying works, which would increase the SS levels
in the receiving marine waters. A single layer of silt curtain shall be
deployed throughout the whole marine sand blanket laying works and the whole DCM works to
minimize the associated potential water quality impact. A single layer of silt
curtain would reduce the dispersion of SS by a factor of 4 (or about 75%). This
efficiency value was developed under the EPD’s Contaminated Spoil Management
Study and has been proven and adopted in all past relevant EIA projects
involving a single layer silt curtain system.
The content of fines in the rock fill of the existing seawall and in the precast concrete blocks of the modified seawall would be negligible. No loss of fines and contaminants would be expected during the removal of the outer section of the existing seawall and placement of new precast concrete blocks on the DCM columns.
5.5.1.8 Construction of Seawater Intake and Outfall
The proposed desalination plant and seawater cooling system would involve
new seawater intake and outfall. The proposed intake and outfall would be
located at the seawall. No submarine intake nor submarine outfall would be
constructed under the Project. Installation of the intake and outfall pipes
would not disturb the seabed or sediments. The pipe installation works will be
incorporated into the land-based construction works of the Project. The intake
and outfall piping work would not create additional water quality impact. No
further assessment is required for the intake and outfall construction.
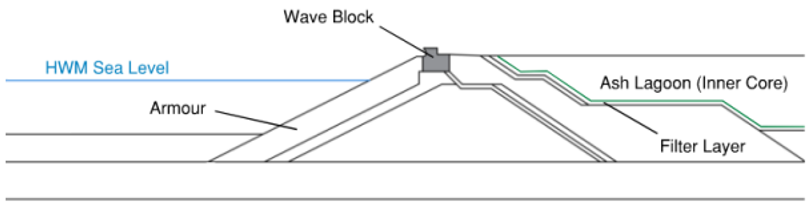
5.5.1.9 Release of PFA Leachate from Ash Lagoon
The Middle Ash Lagoon area
is underlain by marine deposits which consist of fine-grained clay material.
Based on available information [7],
[8],
the thickness of marine deposits may vary from 3.5 to 5 m. Alluvium is present
underneath the marine deposits. Depths of alluvium may vary from approximately
4.0 to 19.0 m. The layer of alluvium is underlain by completely decomposed
granite (CDG) with possible depths ranging from approximately 3.5 to 15.2 m.
The Middle Ash Lagoon area is also bounded by the existing sloping seawall at
the north. Filter layers (in the form of geotextile materials and a layer of
injected bentonite) are laid on the inner face of the existing seawall 5.
The low permeability values of the marine deposits and alluvium at the base of
the ash lagoon as well as the filter layers of the existing seawall would limit
the seepage of PFA leachate into the marine water.
Exhibit 5‑2 Typical Section View of Rubble
Mound Sloping Seawall
During the I∙PARK2 construction, piling would be applied for
foundation construction. The piles would penetrate through the base of the
Middle Ash Lagoon to the hard CDG bedrock to support the facility. The piling
activities would only involve localized displacement of the PFA / fill material
layer. The present of piles would restrict the movement of groundwater across
the lagoon site. Seawall modification works / construction of new berthing
facility would involve removal of the amour stones on the outer face of the seawall
and would not disturb the inner core materials and filter layers. The design
level of the proposed pipeline in West Ash Lagoon would be above PFA surface
and the filter layer. Installation of the outfall structure would be
incorporated into the seawall modification works. The opening of the outfall
structure would be sealed prior to the connection of the seawall pipeline. The
subsequent connection work would be land-based and undertaken behind the
precast concrete block of the modified seawall such that there would be no
release of construction material into the sea. There will be no change to the
permeability of the geological structures of the Middle and West Ash Lagoons
during and after the Project construction. PFA leachate is unlikely to be released
from the ash lagoon into the marine environment. PFA leachate seepage from the
ash lagoon, if any, would not be much different from the existing baseline
condition.
The PFA would remain in the
lagoon and would not be disposed of into the marine environment under the
Project. Further evaluation of the water quality impact by PFA leaching trials
and ecotoxicity test is considered not necessary. No PFA release is
anticipated with reference to the proposed construction design and therefore
further assessment on PFA leachate release is not required.
5.5.2 Operational Phase
5.5.2.1 Introduction
Potential sources of water
quality impacts generated from the operation of the Project include:
n Discharge of saline water from the proposed desalination plant.
n Discharge of spent cooling effluent from the proposed seawater cooling system.
n Changes of hydrodynamics due to the Project discharges and the proposed seawall modification / formation of the permanent berthing facility, which may affect the water quality in Deep Bay.
n Domestic sewage and process wastewater.
n Non-point source surface runoff.
n Maintenance dredging.
n Accidental leakage from delivery of waste and ash to I∙PARK2.
5.5.2.2 Discharge from Desalination Plant and Cooling System
5.5.2.2.1 Option A - Air Cooling System
Air Cooling System
Both air-cooled system and once-through seawater cooling system are
considered as feasible options in the reference design as discussed in Section 2. If air-cooled system is
adopted, there would be no effluent discharge from the cooling system of I∙PARK2.
Desalination Plant
Desalination plant will be provided in I∙PARK2 for freshwater supply. Under Option A without any spent
cooling effluent discharge, the seawall outfall for discharge of brine from the
proposed desalination plant would be located at Middle Ash Lagoon (namely
Outfall Option 1 as shown in in Exhibit 5-3 below). The brine water
drained from the desalination plant is concentrated seawater. Chlorine would be
added to the seawater intake of the desalination system for bio-growth control.
The brine water together with the Total Residual Chlorine (TRC) would be
continuously discharged into the sea at a design effluent flow of about 2,400 m3
per day. Chlorine agent (e.g. sodium hypochlorite etc.) had been
considered as suitable antifoulant in the EIA Report of Liquefied Natural Gas
(LNG) Receiving Terminal and Associated Facilities (AEIAR-106/2007), which is
also considered as a preferable option for this Project. The potential water
quality impact arising from the effluent discharge from the proposed
desalination plant would include the increase of the salinity and TRC levels in
the receiving marine water of Deep Bay.
5.5.2.2.2 Option B - Once-through Seawater Cooling System
Seawater Cooling System
Once-through seawater cooling system is one of the possible
options considered for I∙PARK2 as discussed in Section 2. The proposed seawater
cooling system would discharge spent cooling water with a maximum temperature
elevation of 10 oC. Chlorine would be used as
an anti-fouling agent for the cooling system. Chlorine agent (e.g. sodium
hypochlorite etc.) had been considered as suitable antifoulant in the EIA
Report of Liquefied Natural Gas (LNG) Receiving Terminal and Associated Facilities
(AEIAR-106/2007), which is also considered as a preferable option for this
Project.
The proposed seawater intake of I∙PARK2 would be the same under both Option A and Option B. The
seawater cooling system would utilize the same seawater intake of the proposed
desalination plant. The intake would be located at seawall of Middle Ash
Lagoon. Two alternative seawall outfall options (namely Outfall Option 2 and
Outfall Option 3 as shown in Exhibit 5-3 below) located at West Ash
Lagoon (WAL) are considered for discharge of the spent cooling water. There
would be seasonal variation of the daily effluent flow of the proposed seawater
cooling system as detailed in Appendix 5F. The annual average effluent
flow would be about 1.1M m3 per day. The potential water quality impact arising from the spent cooling
effluent discharge from the proposed seawater
cooling system would include the temperature rise and TRC increase in the
receiving water.
Desalination Plant
Under Option B, the proposed desalination plant would utilize
the same intake and outfall of the once-through seawater cooling system.
Following the same arrangement of the once-through seawater cooling system, two
alternative seawall outfall options located at WAL are considered for discharge
of the brine water. Indicative locations of the two
seawall outfall options (namely Outfall Option 2
and Outfall Option 3) are shown in Exhibit 5-3 below.
5.5.2.2.3
Buffer Distances from Seawater Intakes
Under all the proposed options, the Project would only
involve seawall intake and seawall outfall only. No submarine outfall and
submarine intake would be constructed under the Project. The buffer distances
between the new effluent outfall of I∙PARK2 and the nearby
seawater intakes under the three outfall options are summarized in Table 5-9.
The shortest distance between the new effluent outfall of I∙PARK2 and the closest seawater intake is 300 m. which
complied with requirement of >100 m as stipulated in Section 9 of the
TM-DSS.
Exhibit 5‑3 Alternative Effluent Outfall Options for I∙PARK2
and Nearby Seawater Intakes
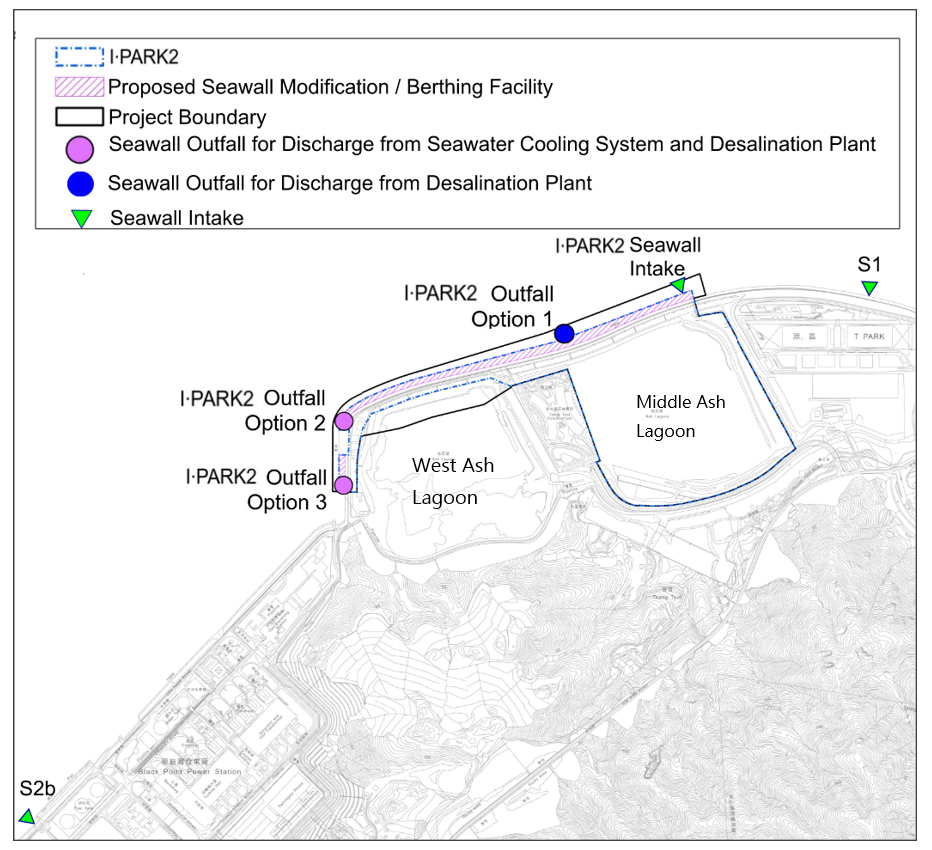
Table 5-9 Buffer
Distances from Nearby Seawater Intakes
|
Alternative Outfall Options of I∙PARK2 (see
Exhibit 5-3) |
Approximate Separation Distances from Effluent
Outfall of I∙PARK2 (m), see Exhibit 5-3 |
||
|
Seawater Intake
of I∙PARK2 |
S1 - Existing Seawater Intake of T∙PARK |
S2b - Existing Seawater Intake of Black Point Power
Station |
|
|
Outfall Option 1 |
300 |
750 |
1790 |
|
Outfall Option 2 |
870 |
1310 |
1290 |
|
Outfall Option 3 |
930 |
1360 |
1180 |
5.5.2.2.4
Dechlorination Process
Sodium Metabisulphite (SMBS) may be dosed into the units of
desalination and seawater cooling systems for dechlorination
as required. SMBS is decayable and
non-toxic to aquatic life, and thus, there is no water quality criterion
available for SMBS [9]. SMBS is a reducing agent and therefore the key concern
would be its potential contribution to an increase in Chemical Oxygen Demand
(COD) and possible Dissolved Oxygen (DO) depletion in the water column.
5.5.2.3 Changes of Hydrodynamics and Water Quality
The seawall modification / permanent berthing facility for I∙PARK2 would slightly change the coastline configuration of
TTAL. Together with the proposed brine and heated cooling water discharges, the
Project may change the hydrodynamic regime in Outer Deep Bay. Significant
changes of the hydrodynamic conditions may affect the dispersion of pollutants
and the water quality in the assessment area.
5.5.2.4 Wastewater Generation
5.5.2.4.1 Introduction
Generally, three types of wastewater would be generated from the Project operation as described below.
5.5.2.4.2 Type 1 Wastewater
Type 1 wastewater would
include bunker and ash leachate, wastewater generated from laboratory, vehicle
and container washing, washing down from the waste reception facilities (e.g.
ramp, unloading platform, weighbridge) as well as the first-flush as described
in Section 5.5.2.5. In general, Type 1
wastewater would be highly contaminated and are typically very high in organic
and ammonia loading. This wastewater stream may contain SS, BOD5,
COD, ammonia, organic contaminants, heavy metals and other toxic contaminants.
The estimated quantity of process wastewater with high organic loading (Type 1
wastewater) generated during operation would be approximately 1,250 m3/day.
5.5.2.4.3 Type 2 Wastewater
Type 2 wastewater, including
domestic sewage and wastewater generated from the workshop washing, is
considered less polluted.
Domestic sewage includes
wastewater generated from the staff and visitors, canteen, and community
facilities. It is typically characterized by
high levels of organic load, ammonia and E. coli counts.
At the workshop area,
chemical wastes would be properly removed and stored in chemical cabinet.
Wastewater generated from washing the workshop may contain grits, dirt and
debris.
It is estimated that
approximately 80 m3/day of Type 2 wastewater would be generated
during operation phase.
5.5.2.4.4 Type 3 Wastewater
The other type of process
wastewater, such as wastewater generated from dehumidification, flue gas washing
and blowdown water from plant machinery of the incineration process, may
contain trace amount of SS, minerals and metals with low/negligible amount of
organic loading. The estimated quantity of process wastewater with
low/negligible amount of organic loading (Type 3 wastewater) generated during
operation would be approximately 1,670 m3/day.
5.5.2.4.5 Wastewater Management
Introduction
Two options for wastewater
treatment and reuse/disposal are proposed as follows:
n Option 1: all wastewater generated from the operation of I∙PARK2 will be directly-reused / treated and re-used on site with no effluent discharge into the nearby water environment.
n Option 2:
discharge of treated effluent from I∙PARK2 to the marine waters of
North Western Water Control Zone (NW WCZ) via Urmston Road Submarine Outfall.
The process flow diagram for
wastewater treatment and management of I∙PARK2 is presented in Appendix
5B and also described as follows (subject to detailed design to be carried
out by the future I∙PARK2 contractor).
Wastewater Management -
Option 1
Type 1 Wastewater
The Type 1 wastewater would
be treated by the high strength wastewater treatment facility provided on-site.
The tentative design treatment capacity of the high strength wastewater
treatment facility would be 1500 m3/day. The treated effluent from
the on-site wastewater treatment facility would meet the tertiary treatment
level and all the treated effluent would be reused on-site in the waste
treatment process (such as for ash stabilization, flue gas cooling, slag cooling
etc.) with no human contact.
Type 2
Wastewater
The domestic sewage and the
workshop washing wastewater would be tertiary treated by the low strength
wastewater treatment facility provided on-site. The tentative design treatment
capacity of the low strength wastewater treatment facility would be 100 m3/day.
The treated effluent shall meet the water quality
standards specified in the “Technical Specifications on Grey Water Reuse and
Rainwater Harvesting” issued by the Water Supplies Department (WSD), as
presented in Table 5-10, and would be used on-site for beneficial reuse
with possible human contact, such as irrigation, toilet flushing and
washing (e.g. road washing).
Table 5-10 Water Quality Standards for Treated Grey
Water and Rainwater Effluent
|
Parameters |
Unit |
Recommended Water Quality Standards |
|
E. coli |
cfu /100 ml |
Non detectable |
|
Total residual chlorine |
mg/l |
≥ 1 exiting treatment
system; |
|
Dissolved oxygen in reclaimed water |
mg/l |
≥ 2 |
|
Total suspended solids (TSS) |
mg/l |
≤ 5 |
|
Colour |
Hazen unit |
≤ 20 |
|
Turbidity |
NTU |
≤ 5 |
|
pH |
6 - 9 |
|
|
Threshold Odour
Number (TON) |
≤ 100 |
|
|
5-day Biochemical oxygen demand (BOD5) |
mg/l |
≤ 10 |
|
Ammoniacal nitrogen (NH3-N) |
mg/l as N |
≤ 1 |
|
Synthetic detergents |
mg/l |
≤ 5 |
Notes:
1.
Apart from total
residual chlorine which has been specified, the water quality standards for all
parameters shall be applied at the point-of-use of the system.
2.
Where recycled water is
treated for immediate usage, the level of total residual chlorine may be lower
than the one specified in this table.
3.
Immediate usage means the
collected grey water/ rainwater is drawn into the treatment process immediate
before a particular round of usage and the treated water will be depleted after
that round of usage is completed.
Rainwater
Harvesting
The harvested roofing rainwater described in Section 5.5.2.5 would be treated by
multimedia filtration, with the design treatment capacity of 100 m3/day,
and reused on-site for vehicle and container washing with possible human
contact. The treated roofing rainwater shall meet the water quality standards presented
in Table 5-10.
Type 3 Wastewater
On the other hand, Type 3
wastewater (e.g. boiler blowdown water) is generated in separate system that is
isolated from any MSW or leachate. This type of wastewater would have a low /
negligible organic loading, and would be reused directly in the waste treatment
processes (such as for ash stabilization, flue gas cooling, slag cooling etc.)
with no human contact. Since the raw quality of Type 3 wastewater is considered
suitable for reuse in the waste treatment process from the design point of view
and the wastewater reuse process will not have any human contact and will not
induce any health concern, pre-treatment of Type 3 wastewater prior to the
reuse is not proposed.
Wastewater Management -
Option 2
Apart from reuse of treated
wastewater for non-potable purposes, the option of discharge of treated
wastewater outside Deep Bay Water Control Zone has been considered. Near the
south boundary of the I∙PARK2 site, there is a sewerage system connecting to
the DSD Lung Kwu Sheung Tan (LKST) Outfall Chamber,
and then the Urmston Road Submarine Outfall, which is located at the North
Western Water Control Zone (NW WCZ). It is proposed to make use of the spare
capacity of this sewerage system for discharge of treated wastewater from I∙PARK2 into NW WCZ via the
Urmston Road Submarine Outfall. The quantity of
effluent discharge from I∙PARK2 to NW WCZ would be about 3,000 m3/day [10]. A discharge licence for discharge of effluent from I∙PARK2
shall be applied under the WPCO. The quality of effluent discharged from I∙PARK2 shall meet the requirements specified in the discharge
licence.
With reference to the requirements stipulated in Annex 6 of EIAO-TM for
effluent discharge into the NW WCZ, secondary treatment plus nitrogen removal
and disinfection shall be adopted for the on-site wastewater treatment system
under Option 2.
5.5.2.4.6 Identification of Potential Impacts
General
Reuse of treated effluent
and treated roofing rainwater generated from the Project will only be applied
within the I∙PARK2 site and will not be used by general public.
Backup power supply in the form of dual power supply or ring main supply or
emergency generator(s) would be provided for all on-site wastewater treatment
facilities to secure electricity supply. Provision of stand-by power and
equipment for the on-site wastewater treatment facilities would prevent the
breaking down of the facilities. Regular maintenance and checking of all
on-site wastewater treatment facilities as well as conveying facilities would
also be carried out to prevent equipment and pipe failure.
Wastewater
Management - Option 1
There will be no discharge of treated or untreated process waters,
domestic sewage and first flush into the environment from the I∙PARK2 site. The proposed
waste reception / treatment related processes and wastewater generation from I∙PARK2 would not cause any
adverse water quality impact.
Wastewater Management -
Option 2
Discharge of effluent via
the Urmston Road Submarine Outfall would potentially affect the water quality
in the NW WCZ. The effluent discharge flow rate of I∙PARK2 would be, on average,
less than 0.04 m3/s. The effluent would be discharged to the marine
waters of NW WCZ via the Urmston Road Submarine Outfall. The water depth at the
Urmston Road Outfall is at least 19 m. The large volume of the receiving marine
water and moving tidal current in Urmston Road would continuously dilute and
disperse the effluent. Provision of the secondary treatment plus nitrogen
removal and disinfection for the effluent discharge would minimize the residual
pollutants. Thus, changes of water quality in NW WCZ caused by the Project
discharge are expected to be minimal. The potential water quality impacts
associated with the treated effluent discharge are further evaluated in Section
5.7.2.4.
5.5.2.5 Non-point Source Surface Runoff
Surface runoff to be
generated from the Project is known as non-point source pollution. The
stormwater that initially runs off the area is called the “first-flush”, which
contains most of the pollution loads, if any. MSW and leachate could be
deposited on the surfaces of the waste reception and treatment facilities
within the I∙PARK2 site. Most of the waste
reception and treatment facilities of this Project have been designed to be
covered or located within buildings. The roofing rainwater is generally
uncontaminated, and will be harvested and treated for beneficial reuse with
possible human contact (see Section 5.5.2.4.5). For uncovered paved areas
within the Project site for handling / delivery of MSW containers (including
the new berthing facility and elevated platform along the northern Project
boundary and open vehicular access for MSW delivery trucks), a low flow interceptor
drainage system will be provided to intercept the first flush and convey it to
the on-site wastewater treatment facility for treatment as a precautionary
measure (see Section 5.5.2.4.5). As such, pollutants on
the uncovered paved areas, if any, would not be washed into the nearby
stormwater and inland/marine water systems.
On the other hand, other
road runoff within the I∙PARK2 site may contain a small amount of oil, grease
and grit deposited from vehicles. Surface runoff generated from other paved or
developed areas within the I∙PARK2 site may also contain debris, refuse, dust.
These non-point source surface runoffs may affect the quality of the nearby
receiving water environment, if uncontrolled.
5.5.2.6 Maintenance Dredging
Under the current operation,
most of the MSW is delivered to the WENT Landfill via marine route. This marine
route runs along the shore of TTAL and passes through the seafront of the I∙PARK2 site. During the
operational phase of I∙PARK2, MSW will be delivered to I∙PARK2 using the same marine route. Maintenance dredging of the
existing marine route to facilitate navigation of waste delivery vessels to and
from the proposed berthing facility may be required on an as-needed basis
subject to the seabed level, which would be similar to the current operation
associated with the WENT Landfill. As only very infrequent maintenance dredging
is required to maintain the water depth along the existing marine route, the
associated water quality impact would be insignificant. Since the maintenance
dredging work is an existing operation, any future maintenance dredging during
the I∙PARK2 operation would not create any additional water quality
impact. The water quality impacts would be similar to those under the existing
baseline scenario and therefore, no further assessment on maintenance dredging
is considered necessary.
5.5.2.7 Accidental Leakage During Delivery of Waste and Ash
The waste / ash will be
placed in containers that are sealed to prevent spillage of the contents during
transportation.
The containers shall be in
good condition and free from damage or any other defects. Similar to the
existing baseline situation, spillage or leakage during the waste / ash
delivery is not expected during the operational phase, and further assessment
is not required.
5.6.1 Modelling Tools
5.6.1.1 Modelling Platforms
Mathematical
modelling was performed using the hydrodynamic and water quality modelling
platforms, namely the D-Flow Flexible Mesh and
D-Water Quality of Delft3D Flexible Mesh Suite, developed by Deltares.
The D-Flow
Flexible Mesh was applied to simulate the hydrodynamics effects such as the
changes of salinity and temperature due to the proposed desalination plant and
seawater cooling system of I∙PARK2. The cumulative hydrodynamic effects due to the seawall
modification / formation of the permanent berthing facility for I∙PARK2 were incorporated and assessed using
the D-Flow Flexible Mesh.
The D-Water
Quality module was used to simulate the dispersion and transportation of
sediment plumes, TRC and Sodium Metabisulphite (SMBS) based on the relevant
flow fields determined by the D-Flow Flexible Mesh.
5.6.1.2 Model Selection and Development
The Regional
Delft3D Flexible Mesh Hong Kong (HK-DFM) Model provided by EPD was employed for
this EIA. The HK-DFM Model was developed and verified under the EPD’s study
“Provision of Consultancy Services for HATS 2A Post Project Monitoring” in
2021. The HK-DFM Model covers
Pearl River Estuary, Macau, Ma Wan Channel, Cheung Chau, East Lamma Channel,
Victoria Harbour, Tathong Channel, Nine Pin Islands,
Po Toi Island, etc. Major influences on hydrodynamics (including the Pearl
River discharge, spatio-temporal variations of
meteorological forcing and oceanic current in the South China Sea) are
incorporated into the HK-DFM Model.
For the purpose
of this EIA study, the grid layout of the HK-DFM Model has been refined in the
outer Deep Bay to give better representation of the coastline configuration
near the Project site. Plots 01 to 03 of Appendix 5C shows the grid
layout and properties of the refined HK-DFM Model. The refined model has a grid
resolution of no greater than 75 m by 75 m at or in the vicinity of the
proposed Project works. Additional model grids have been added to cover the
Tsang Kok Stream Outfall.
The performance
of the refined HK-DFM Model has been verified to be consistent with the
performance of the original HK-DFM Model as shown in Plots No. 5 to 14 of Appendix
5C. The main purpose of the model performance verification or comparison is
to illustrate that the model settings of the refined model were carried out
correctly. The same model set-up such as the model bathymetry of the original
HK-DFM Model was applied in the refined model for performance verification.
The salinity
levels predicted by the refined HK-DFM Model are also compared against the
field data collected by EPD at two closest stations (DM4 and DM5) and the
comparison results are included in Plot No. 15 to 17 of Appendix 5C. For
the purpose of checking the model performance, the salinity levels predicted by
the refined model are compared with the salinity data measured by EPD in 2021
and 2022 as presented in Appendix 5C.
5.6.1.3 Simulation Periods
The hydrodynamics
and water quality simulations were conducted using D-Flow Flexible Mesh and
D-Water Quality respectively.
For studying the
construction phase impact (due to the sand blanket laying) and operational
phase impact (due to the thermal and brine discharges), the simulations cover
at least one 15-day full spring-neap cycle (excluding the spin-up period) for
each of the dry and wet seasons.
A spin-up period
of 1 complete calendar year was provided for each simulation for both
construction and operational stages.
Spin-up test was
conducted by repeating the same on one-year simulation in sequence for three
times. The model results for the second year and the third year are compared in
Appendix 5D for two 15-day spring-neap periods in dry and wet seasons
respectively. The comparison showed that the results for the two
consecutive years are consistent with each other. Therefore, the spin-up period
of 1 complete calendar year is considered sufficient.
The hydrodynamic
results generated from the D-Flow Flexible Mesh simulations were used to drive
the D-Water Quality simulations.
5.6.1.4 General Model Settings
The general
settings of the refined model such as the approach to the setup of boundary and
initial conditions as well as the model coefficients and parameters follow
those adopted in the original HK-DFM Model provided by EPD.
5.6.1.5 Coastline Configurations
The existing
coastline configurations have incorporated all completed or on-going coastal
projects such as the Tuen Mun - Chek Lap Kok Link (TM-CLKL), Expansion of Hong
Kong International Airport into a Three-Runway System (3RS) and Tung Chung New
Town Extension (TCNTE). Additional planned projects that would affect the
coastline configurations have also been included in the construction and
operational stage modelling as summarized in Table 5-11.
Table 5-11 Planned Projects Affecting Coastline
Configuration
|
Modelling Scenario |
Year
Horizon |
Planned
Projects Affecting the Coastline |
Layout
Reference |
|
Construction stage impact scenario |
2026 |
Tsang Kok Stream Outfall Modification for
WENTX |
Figure 2.2 |
|
Operational stage baseline scenario without this
Project |
2030s |
Tsang Kok Stream Outfall
Modification for WENTX |
Figure 2.2 |
|
Reclamation for Kau Yi
Chau Artificial Islands |
LC Paper No. CB(1)930/2022(01) |
||
|
Reclamation for Road P1 |
EIA study brief No. ESB-337/2020 |
||
|
Reclamation for Route 11 |
EIA Study Brief No. ESB-352/2022 |
||
|
Lung Kwu
Tan Reclamation |
EIA Study Brief No. ESB-367/2024 |
||
|
Tsing Yi - Lantau Link |
EIA Study Brief No. ESB-359/2023 |
||
|
Operational stage impact scenario with this Project |
2030s |
Tsang Kok Stream Outfall
Modification for WENTX |
Figure 2.2 |
|
Reclamation for Kau Yi Chau Artificial Islands |
LC Paper No. CB(1)930/2022(01) |
||
|
Reclamation for Road P1 |
EIA study brief No. ESB-337/2020 |
||
|
Reclamation for Route 11 |
EIA Study Brief No. ESB-352/2022 |
||
|
Lung Kwu
Tan Reclamation |
LC Paper No. CB(1)141/2023(03) |
||
|
Tsing Yi-Lantau Link |
EIA Study Brief No. ESB-359/2023 |
||
|
Proposed Seawall Modification / Berthing Facility
for I∙PARK2 |
Figure 5.1 |
Hydrodynamics
effect of existing and planned link road / bridge projects would be minor.
Their bridge pier effect on hydrodynamics is not considered in the modelling.
Any further
reclamation in the Tseung Kwan O water is over 40 km away from the I∙PARK2 site and their effect on the
hydrodynamics in Deep Bay is expected to be negligible and are therefore not
considered in this modelling exercise.
5.6.1.6 Model Bathymetry
Under this EIA
study, the model bathymetry schematization has been updated in accordance with
the latest marine charts issued by the Hydrographic Office of Marine Department
in 2021. No capital dredging is proposed under this Project.
Therefore, the updated model bathymetry representing the existing conditions
was adopted for both construction and operational phase modelling.
5.6.2 Construction Phase
5.6.2.1 General Construction Activities
The water quality impacts
due to construction site runoff, spent effluent from dust suppression sprays,
wastewater generation from land-based construction activities, general refuse,
accidental chemical spillage and sewage from construction workforce were
assessed using qualitative approach. Potential sources of water quality impact
that may arise during the construction of the Project are described. All the
identified sources of potential water quality impact were then evaluated, and
their impact significance determined. Mitigation measures to reduce any
identified impacts on water quality have been recommended.
5.6.2.2 Seawall Modification / Construction of Permanent Berthing Facility
5.6.2.2.1
Introduction
The possible sediment loss and accidental discharge of cement slurry as well as the possible thermal impact associated with the DCM operation were assessed using qualitative approach with the support of past relevant water quality monitoring data collected for a large-scale DCM project.
Loss of fines from the sand blanket laying to be carried out prior to the DCM operation were assessed quantitatively using the refined HK-DFM Model. The mathematical modelling approach is described in Section 5.6.2.2.2 to Section 5.6.2.2.6 below.
5.6.2.2.2
Assessment Criteria
Introduction
The ambient values and tolerance limits for SS, DO and the sediment deposition limit that are relevant to the sand blanket laying work are tabulated for each WSR in Table 5-12.
Table 5-12 Assessment Criteria for Construction
Phase
|
Description |
ID |
Nearest EPD Station |
Assessment Water Depth |
SS (mg/L) |
DO (mg/L) |
Sediment Deposition Rate (g/m2/day) |
|||||
|
Ambient (3) |
Allowable Increase |
Ambient (3) |
WQO (6) |
Allowable Depletion |
|||||||
|
Dry Season |
Wet Season |
Dry Season |
Wet Season |
||||||||
|
Water
Sensitive Receivers |
|||||||||||
|
Seawater Intake of |
S1 |
DM5 |
Depth average |
12.9 |
13.5 |
117.1(4) |
116.5(4) |
NA |
NA |
NA |
NA |
|
Seawater Intakes of BBPS |
S2a |
DM5 |
Depth average |
12.9 |
13.5 |
700(5) |
700(5) |
NA |
NA |
NA |
NA |
|
S2b |
DM5 |
Depth average |
12.9 |
13.5 |
700(5) |
700(5) |
NA |
NA |
NA |
NA |
|
|
Mudflat / Seagrass / Horseshoe
Crab at Ha Pak Nai |
E1 |
DM4 |
Bottom |
19 |
16.7 |
5.7 |
5.0 |
4.33 |
NA |
NA |
100 |
|
Surface |
15.2 |
15.0 |
4.6 |
4.5 |
4.73 |
5 |
Note (8) |
NA |
|||
|
Mudflat / Seagrass /
Horseshoe Crab at Sheung Pak Nai |
E2 |
DM4 |
Bottom |
19 |
16.7 |
5.7 |
5.0 |
4.33 |
NA |
NA |
100 |
|
Surface |
15.2 |
15.0 |
4.6 |
4.5 |
4.73 |
5 |
Note (8) |
NA |
|||
|
Sha Chau and Lung Kwu Chau Marine Park |
E3 |
NM5 |
Depth average |
14.7 |
20.1 |
4.4 |
6.0 |
4.29 |
4 |
0.29 |
NA |
|
Pak Nai SSSI |
E4 |
DM4 |
Depth average |
17.1 |
14.7 |
5.1 |
4.4 |
4.56 |
NA |
NA |
NA |
|
Surface |
15.2 |
15.0 |
4.6 |
4.5 |
4.73 |
5 |
Note (8) |
NA |
|||
|
Traditional Oyster
Production Area |
F1 |
DM4 |
Depth average |
17.1 |
14.7 |
5.1 |
4.4 |
4.56 |
NA |
NA |
NA |
|
Surface |
15.2 |
15.0 |
4.6 |
4.5 |
4.73 |
5 |
Note (8) |
NA |
|||
|
Mariculture Subzone |
F2 |
DM4 |
Depth average |
17.1 |
14.7 |
5.1 |
4.4 |
4.56 |
NA |
NA |
NA |
|
Surface |
15.2 |
15.0 |
4.6 |
4.5 |
4.73 |
5 |
Note (8) |
NA |
|||
|
Important Spawning Ground
of Commercial Fisheries Resources |
F3 |
NM5 |
Depth average |
14.7 |
20.1 |
4.4 |
6.0 |
4.29 |
4 |
0.29 |
NA |
|
Observation
Points |
|||||||||||
|
Oyster Culture Activities
Outside Mariculture Subzone |
O1 |
DM4 |
Depth average |
17.1 |
14.7 |
5.1 |
4.4 |
4.56 |
4 |
0.56 |
NA |
|
O2 |
DM5 |
Depth average |
12.9 |
13.5 |
3.9 |
4.1 |
4.47 |
4 |
0.47 |
NA |
|
|
O3 |
DM4 |
Depth average |
17.1 |
14.7 |
5.1 |
4.4 |
4.56 |
4 |
0.56 |
NA |
|
Notes:
(1)
Details of assessment criteria are also
presented in Section 5.3.
(2)
Shaded cells represent the proposed
assessment criteria for construction phase.
(4)
Allowable increase is derived from the
subtraction of design water quality of intake specified in Section 5.3.7.1 by
the ambient level.
(5)
Allowable SS increase is specified by
the intake operator (see Appendix 5A).
(6)
The WQO for DO under the WPCO is a
10%ile value.
(7)
NA: Not applicable.
(8)
Five WSRs (E1, E2, E4, F1 and F2) are
located within Mariculture Subzone where the WQO for DO is defined for surface
water layer only. No WQO for depth average DO is available. The ambient 10th
percentile surface DO level at these WSRs exceeded the WQO. Further DO
depletion should be minimized as far as possible.
Suspended Solids Criteria for Ecological and
Fisheries Sensitive Receivers
The ambient Suspended Solids (SS) levels are derived using the concentrations measured by EPD during the period from 2018 to 2022 at the stations nearest to the WSRs. With reference to the WQO, any sediment plume generated from the Project shall not cause the ambient SS concentrations to be elevated by more than 30% at any time. It is proposed to analyse the ambient data for both dry season and wet season and define the ambient values for each season as 90th percentile (%ile) of the measured SS levels. The allowable SS increase at the receivers is calculated as 30% of these ambient values.
Suspended
Solids Criteria for Seawater Intakes
For the seawater intakes of BBPS, the absolute SS limit of 764 mg/L and a tolerance SS increase of 700 mg/L as specified by their operators are used.
The upper design SS level of 130 mg/L is adopted for the seawater intake of T∙Park.
For the seawater intake of CPPS, no SS criteria are specified by the intake operator. The CPPS intake is a distant receiver. This intake is not further considered in the assessment.
Oxygen Depletion at Ecological and Fisheries Sensitive
Receivers
According to the WQOs for DO, the measured DO levels can be less than the numerical objective value of 5 mg/L for 10% of samples collected during the whole year. The ambient levels are thus presented as 10%ile of the DO concentrations measured by EPD at the relevant stations during the period from 2018 to 2022, which is a conservative approach. The allowable DO depletion is calculated by subtracting the WQO from the ambient DO level except for the WSRs within Mariculture Subzone (E1, E2, E4, F1 and F2).
The ambient 10%ile level of surface DO for E1, E2, E4, F1 and F2 (4.73 mg/L) as shown in Table 5-12 is less than the WQO of ≥5 mg/L for mariculture subzone. Further DO depletion at these WSRs should be minimized as far as possible.
Oxygen Depletion at Seawater Intakes
The identified seawater intakes within the assessment area are not sensitive to DO depletion. No assessment criterion on DO is available for the intake points.
Sediment Deposition Rate
The absolute sediment deposition criterion of 100 g/m2/day are only applicable to the benthic communities (see Section 5.3.5).
5.6.2.2.3
Sediment Loss Rates
Sand Blanket Laying
Sand blankety laying would be
carried out to cover the DCM works areas prior to the commencement of the DCM
works to prevent loss of sediment and contaminants during the DCM operation. It
is assumed that 5% of the fine content in the sand fill would be lost during
the sand laying as adopted in all past EIA studies involving sand filling [11], [12], [13], [14], [15]. The typical fine content and dry density of sand fill is
5% of the bulk and 1680 kg/m3 respectively. All quoted past EIA studies involve either bottom dumping
of sand fill or filling by trailer suction hopper dredger (TSHD) discharging
sand at a much higher rate. The scale of sand laying for seawall modification /
construction of the berthing facility for I∙PARK2 is much smaller as compared to those proposed under
the past EIA studies. The sand laying for I∙PARK2 would be undertaken at a much smaller rate of 3,000 m3/day
by using a closed grab. The closed grab can release the sand at a point near
the seabed in a controlled manner. Thus, the proposed spill rate for sand
laying is considered appropriate. Assuming a working period of 16 hour per day,
the resulted sediment loss rate would be 12,614 kg/day.
DCM Column
Installation
During the course of DCM column installation, no sediment loss is
anticipated as supported by the recent full-scale DCM monitoring results as
discussed in Section 5.7.1.6.1 below. It is
conservatively assumed that 5% of the fine content of the sand blanket within
the working area of the DCM rigs would be released into the water environment
during the insertion and withdrawal of the piling pile of mixing treatment
equipment. In reality, the sand material would only be laterally displaced and
would not be significantly disturbed. The marine works area of this Project is
minor in scale. A typical working area for each DCM rig with “square four”
cluster of DCM columns would be 2.2 m x 2.2 m = 4.84 m2, whilst the
thickness of sand blanket would be 1 m. Considering that the fines content and density of sand fill is 5% of the bulk and 1680 kg/m3
respectively, the estimated amount of fines to be
released during the insertion or withdrawal of piling piles would be 20.328 kg
= 4.84 m2 (works area) x 1 m (sand thickness) x 1 680 kg/m3
(sand density) x 5% (fines content of sand fill) x 5% (spill rate).
Each DCM
installation cycle would typically last for about 80 minutes. Within the daily
working period of 16 hours, there would be 12 DCM installation cycles. Each DCM
installation cycle would involve 1 insertion and 1 withdrawal of the piling
pile. Assuming there would be 10 DCM rigs working concurrently on-site, the sediment loss rate due to insertion and withdrawal of
piling piles would be about 4,879 kg/day (=20.328 kg x 24 times per day x 10
DCM rigs).
5.6.2.2.4
Modelling Scenarios
The indicative sequence and phasing
of key sediment generating activities are summarized in Table 5-13. Sand blanket laying is identified as the key source of sediment
release during the marine construction period of the Project. The sediment release for DCM operation is only included for illustration
purpose. In reality, no sediment release would be anticipated from the DCM
works.
Table 5-13 Indicative Construction Sequence
of Key Sediment Generating Marine Activities
|
Works Area |
Marine Construction Activities |
Assumption of Concurrent Operating Equipment |
Sediment
Release Rate (kg/day) |
|||||||||||||
|
Month |
||||||||||||||||
|
1 |
2 |
3 |
4 |
5 |
6 |
7 |
8 |
9 |
10 |
11 |
12 |
|||||
|
Middle Ash Lagoon |
Sand blanket
laying |
1 closed grab dredger |
12,614 |
|
|
|
|
|
|
|
|
|
||||
|
DCM Column Installation |
10 DCM rigs |
|
|
|
4,879 |
|
|
|
|
|
|
|||||
|
West
Ash Lagoon |
Sand blanket
laying |
1 closed grab dredger |
|
|
|
|
|
|
12,614 |
|
|
|
||||
|
DCM Column Installation |
10 DCM rigs |
|
|
|
|
|
|
|
|
|
4,879 |
|||||
Two sediment modelling scenarios, namely Scenario A1 and Scenario A2 respectively, were undertaken. Under Scenario A1, one closed grab (Source ID: G1) is assumed to be working at the shore of Middle Ash Lagoon for sand laying in 2026. Under Scenario A2, one closed grab (Source ID: G2) is assumed to be working at the shore of West Ash Lagoon for sand laying in 2027. The sediment release points and the calculation of sediment loss rates are shown in Appendix 5E.
5.6.2.2.5
Modelling Parameters
The general parameters adopted for sediment plume modelling are as follows:
n Settling velocity - 0.5 mm/s
n Critical shear stress for deposition - 0.2 N/m2
n Critical shear stress for erosion - 0.3 N/m2
n Minimum depth where deposition allowed - 0.1 m
n Resuspension rate - 30 g/m2/d
The above parameters including the settling velocity of 0.5 mm/s have been adopted in numerous past studies in Hong Kong. [16], [17], [18], [19], [20], [21], [22] With reference to these past studies, the critical shear stress values for erosion and deposition were determined by laboratory testing of a large sample of marine mud from Hong Kong as part of the WAHMO [23] studies associated with the new airport at Chek Lap Kok.
5.6.2.2.6
Consideration of Concurrent Projects
The Modification of Tsang Kok Stream Outfall under the proposed WENT Landfill Extension would be commenced tentatively in 2024. The marine construction work under the proposed WENT Landfill Extension is anticipated to be substantially completed before the commencement of the marine construction work of I∙PARK2, therefore no adverse cumulative water quality impact arising from marine construction work is predicted.
5.6.3
Operational Phase
5.6.3.1 Discharges from Desalination Plant and Seawater Cooling System / Changes
of Coastline Due to Proposed Seawall Modification / Berthing Facility
5.6.3.1.1
Assessment Criteria
The WQOs for temperature and salinity as well as the USEPA standards for TRC are adopted as the assessment criteria for ecological and fisheries receivers.
The design temperature range provided by the intake operator is adopted for the seawater intake of T∙Park. No TRC and salinity criteria are specified for the seawater intakes of T∙Park and therefore, this intake is not further considered in the salinity and TRC assessment.
No intake criteria on temperature, salinity and TRC are available for the seawater intakes of BPPS and CPPS as specified by their intake operators. These intakes are therefore not further considered in the operational phase assessment.
The assessment criteria for
operational phase are summarized in Table 5-14.
Table 5-14 Assessment Criteria for Operational
Phase
|
Description |
ID |
Assessment
Water Depth |
Temperature (oC) |
Salinity
(%) |
TRC
(mg/L) |
|
|
Chronic
Criterion (4-day
average) |
Acute
Criterion (1-hour average) |
|||||
|
Water Sensitive Receivers |
||||||
|
Intake of T∙Park |
S1 |
Mid-depth |
31 |
NA |
NA |
NA |
|
Mudflat / Seagrass / Horseshoe Crab at Ha Pak
Nai |
E1 |
Bottom |
Change ≤ 2 |
Change ≤ 10 |
0.0075 |
0.013 |
|
Mudflat / Seagrass / Horseshoe Crab at Sheung
Pak Nai |
E2 |
Bottom |
Change ≤ 2 |
Change ≤ 10 |
0.0075 |
0.013 |
|
Sha Chau and Lung Kwu
Chau Marine Park |
E3 |
Depth
average |
Change ≤ 2 |
Change ≤ 10 |
0.0075 |
0.013 |
|
Pai Nai SSSI |
E4 |
Depth
average |
Change ≤ 2 |
Change ≤ 10 |
0.0075 |
0.013 |
|
Traditional Oyster Production Area |
F1 |
Depth
average |
Change ≤ 2 |
Change ≤ 10 |
0.0075 |
0.013 |
|
Mariculture Subzone |
F2 |
Depth
average |
Change ≤ 2 |
Change ≤ 10 |
0.0075 |
0.013 |
|
Important Spawning Ground of Commercial
Fisheries Resources |
F3 |
Depth average |
Change ≤ 2 |
Change ≤ 10 |
0.0075 |
0.013 |
|
Observation
Points |
||||||
|
Oyster Culture Activities Outside Mariculture
Subzone |
O1 |
Depth
average |
Change ≤ 2 |
Change ≤ 10 |
0.0075 |
0.013 |
|
O2 |
Depth
average |
Change ≤ 2 |
Change ≤ 10 |
0.0075 |
0.013 |
|
|
O3 |
Depth average |
Change ≤ 2 |
Change ≤ 10 |
0.0075 |
0.013 |
|
Notes:
Details of the assessment criteria are presented in Section
5.3.
NA Not available
The possible DO depletion caused by the SMBS (if any) in the discharges of the Project are evaluated with reference to the allowable DO depletion adopted for the construction phase as shown in Table 5-27.
5.6.3.1.2
Modelling Scenarios
Three modelling scenarios were simulated to predict the changes of hydrodynamics and water quality as follows.
Scenario B1: Baseline scenario without I∙PARK2 in 2030s.
Scenario B2: Impact scenario with I∙PARK2 in 2030s using Outfall Option 1.
Scenario B3: Impact scenario with I∙PARK2 in 2030s using Outfall Option 2.
Scenario B4: Impact scenario with I∙PARK2 in 2030s using Outfall Option 3.
Major seawater intakes and outfalls of other industrial establishments including T∙Park, BPPS and CPPS are included in all the four scenarios for cumulative impact assessment. Scenarios B2, B3 and B4 have also incorporated the effect of seawater intake and outfall systems of I∙PARK2 as well as the change of coastline configuration due to the proposed seawall modification / berthing facility.
Under Scenario B2, air-cooled system is assumed to be adopted for I∙PARK2 and therefore only brine discharge at the seawall of Middle Ash Lagoon (Outfall Option 1) would be involved during the Project operation.
If once-through seawater cooling system is selected for I∙PARK2, two alternative seawall outfall locations at the West Ash Lagoon (Outfall Option 2 and Outfall Option 3) are considered under Scenario B3 and Scenario B4 respectively. The desalination plant and seawater cooling system of I∙PARK2 will share the same intake and outfall locations. The design seawater intake rate and effluent flow of the desalination plant would be approximately 4,000 m3/day and 2,400 m3/day respectively. The design discharge rates of the seawater cooling system would be equal to the design intake flow rates of the cooling system, which would vary seasonally.
The intake and outfall assumptions adopted in the modelling exercise are described in Appendix 5F.
The TRC was modelled as decayable tracer with decay value T90 = 8289s. The same TRC decay rate was adopted in other past EIAs with similar discharges [24], [25], [26], [27], [28] .
The model results are compared between Scenario B1, Scenario B2, Scenario B3 and Scenario B4 to predict the changes of salinity and temperature and TRC increase due to this Project. Changes of permanent flow regime are assessed by comparing the model results between the scenarios in terms of the tidal flow rates across the Outer Deep Bay as well as the flow vectors and current speeds in the assessment area.
5.6.3.2 Other Water Pollution Sources
Other potential sources of water quality impacts that may arise during the operational phase (including wastewater generation and non-point source surface runoff) were qualitatively evaluated and their impact significance determined (see Section 5.7.2.3, Section 5.7.2.5 and Appendix 5J). Mitigation and design measures to reduce any identified water quality impacts was also determined and recommended.
5.7.1 Construction Phase
5.7.1.1 Construction Site Runoff and Dust Suppression Sprays
Runoff would be generated from the construction works area. The potential sources of pollution include runoff and erosion from exposed soil/PFA surfaces, earth working areas and stockpiles; as well as wash water from dust suppression sprays. All temporarily exposed surfaces, dusty stockpiles and earth working areas should be securely covered immediately after the works have been completed to prevent soil/PFA erosion. Earthwork final surfaces should be well compacted and subsequent permanent work or surface protection should be immediately performed.
Relevant mitigation measures outlined in ProPECC PN 2/23 “Construction Site Drainage” should be implemented to control construction site runoff and drainage from the works areas, and to prevent runoff and drainage water with high levels of SS from entering the nearby water bodies. The construction site runoff and spent dust suppression sprays should be collected by the temporary drainage system installed by the Contractor and then treated on-site before discharging into the storm drains via silt removal facilities. The treated discharges shall meet the respective effluent standards applicable to the receiving waters as set out in the TM-DSS. No adverse water quality impact would be anticipated provided that all mitigation measures recommended in Section 5.8.1.1 and Section 5.8.1.4 are properly implemented.
5.7.1.2 Wastewater from General Land-based Construction Activities
Land-based construction activities may generate wastewater such as boring and drilling effluent and wheel washing water. Their impacts are likely to be minimal, provided that good construction practices and proper site management would be observed and implemented. Effluent discharge from temporary site facilities should be controlled to prevent direct discharge to the neighbouring water environment. It is anticipated that water quality impacts caused by wastewater generation from land-based construction activities would be insignificant with adequate implementation of recommended mitigation measures in Section 5.8.1.2 and Section 5.8.1.4.
5.7.1.3 General Refuse
Good housekeeping measures
and regular refuse collection programme should be adopted to mitigate the
potential water quality impact associated with the refuse generation in
construction site. With proper implementation of the recommended mitigation
measures and good site practices in Section 5.8.1.3, there would be no adverse
water quality impacts due to refuse generation.
5.7.1.4 Accidental Chemical Spillage
All chemicals should be
handled, stored and disposed properly to avoid and contain spillage. Good
construction practices should be implemented to prevent accidental spillage
from maintenance activities. With proper implementation of all mitigation
measures recommended in Section 5.8.1.5, no adverse water quality
impacts would arise.
5.7.1.5 Sewage Effluent from Construction Workforce
Based on the Drainage
Services Department (DSD) Sewerage Manual, the sewage production rate for
construction workers is estimated at 0.35 m3 per worker per day. For
every 100 construction workers working simultaneously at the construction site,
about 35 m3 of sewage would be generated per day. Sewage generated
from construction workforce can be adequately treated by interim sewage
treatment facilities, such as portable chemical toilets, which can be installed
within the construction site. No discharge of sewage effluent into the
environment will be allowed under this Project.
Provided that sewage is not
discharged directly into storm drains or inland/marine waters adjacent to the
construction site, and temporary sanitary facilities are serviced and properly
maintained by a licensed waste collector as recommended in Section 5.8.1.6, sewage generated from the
site would not cause any adverse water quality impact.
5.7.1.6 Seawall Modification / Construction of Permanent Berthing Facility
5.7.1.6.1
Deep Cement Mixing (DCM)
The DCM method enables in-situ
stabilisation of the underlaying materials of the proposed seawall modification
/ berthing facility. It is capable to treat sediment in deep layer without
excavation, dredging, shoring or dewatering, and thus there is less exposure of
wastes to the water environment.
By deployment of silt
curtain and placing the sand blanket layer on top of the DCM works areas before
the DCM treatment, release of fines and cement slurry from the DCM operation
would be negligible.
The piling pipe of the DCM
equipment would contact the longitudinal surface of the materials to be
treated. Any heat dissipation from the exothermic process of DCM would largely
occur within the materials immediately surrounding the DCM column, which is beneath
the seabed. Any minor heat dissipation from the top of DCM columns will be
absorbed by the sand blanket laid above the DCM columns. Thermal impact due to
DCM would be negligible.
The DCM method has been
proven and adopted in Hong Kong. Recent DCM applications include the foundation
of breakwater and seawall around the artificial island for development of
Integrated Waste Management Facilities Phase 1 (I∙PARK1) at Shek Kwu Chau. Marine water quality monitoring was conducted
under the I∙PARK1 during the DCM trials held in July, September, October
and December 2018 and the full-scale DCM conducted within the period from
February 2019 to October 2020 [29].
Salinity, pH, DO, turbidity, temperature, SS and total alkalinity were
monitored in locations close to the artificial island, at representative WSRs
and control stations further away. The monitoring has demonstrated that there
were no adverse water quality impacts associated with the DCM. Elevated
pollution levels due to the DCM works were not recorded.
According to approved EIA
for Expansion of Hong Kong Airport into a Three-Runway System (3RS)
(AEIAR-185/2014), overseas application and the local site trial of DCM held in
February 2012 has demonstrated that there was no adverse water quality impact
associated with the DCM installation works. This was further confirmed after
the approval of the EIA for 3RS under both the intensive DCM water quality
monitoring and regular DCM monitoring for full-scale DCM applications in 3RS
between 2017 and 2019.
The scale of DCM works
proposed under this Project is minimal as compared to the seawall construction
for I∙PARK1. Based on the past monitoring results, no adverse water
quality impact is expected from the small-scale DCM works for I∙PARK2.
5.7.1.6.2 Sand Blanket Laying
Elevation of SS and
Sedimentation under Unmitigated Scenario
Loss of fines could arise from the proposed sand blanket laying work and the associated water quality impact was quantitatively assessed by mathematical modelling.
Two sediment dispersion
modelling scenarios, namely Scenario A1 and Scenario A2, were simulated as
defined in Appendix 5E and Section 5.6.2.2.4. The results for SS
elevations and sedimentation rates predicted at the representative WSRs under
the two unmitigated scenarios are presented in Table 5-15 and Table 5-16. The distant intake of CPPS
is not considered as no SS criteria are available for this intake.
Table 5-15 Predicted
SS Elevations and Sedimentation Rates - Unmitigated Scenario A1
|
Description |
ID |
Water Depth |
Maximum SS Elevation
(mg/L) |
Maximum Sediment
Deposition (g/m2/day) |
|||||
|
Dry Season |
Wet Season |
Criteria |
Dry Season |
Wet Season |
|||||
|
Criteria |
Predicted Level |
Criteria |
Predicted Level |
||||||
|
Water
Sensitive Receivers |
|||||||||
|
Intake of T∙Park |
S1 |
Depth average |
117.1 |
6.8477 |
116.5 |
8.0821 |
- |
- |
- |
|
Intakes of BBPS |
S2a |
Depth average |
700 |
0.3548 |
700 |
0.4472 |
- |
- |
- |
|
S2b |
Depth average |
700 |
0.7390 |
700 |
0.5367 |
- |
- |
- |
|
|
Mudflat / Seagrass / Horseshoe Crab at Ha Pak Nai |
E1 |
Bottom |
5.7 |
0.1894 |
5.0 |
0.3563 |
100 |
5.107 |
11.489 |
|
Surface, Note 1 |
4.6 |
0.1036 |
4.5 |
0.3246 |
- |
- |
- |
||
|
Mudflat / Seagrass / Horseshoe Crab at Sheung Pak
Nai |
E2 |
Bottom |
5.7 |
<0.0001 |
5.0 |
0.0092 |
100 |
<0.001 |
0.305 |
|
Surface, Note 1 |
4.6 |
<0.0001 |
4.5 |
0.0082 |
- |
- |
- |
||
|
Sha Chau and Lung Kwu Chau
Marine Park |
E3 |
Depth average |
4.4 |
0.0080 |
6.0 |
0.0036 |
- |
- |
- |
|
Pai Nai SSSI |
E4 |
Depth average |
5.1 |
<0.0001 |
4.4 |
0.0080 |
- |
- |
- |
|
Surface, Note 1 |
4.6 |
<0.0001 |
4.5 |
0.0071 |
- |
- |
- |
||
|
F1 |
Depth average |
5.1 |
<0.0001 |
4.4 |
0.0287 |
- |
- |
- |
|
|
Surface, Note 1 |
4.6 |
<0.0001 |
4.5 |
0.0245 |
- |
- |
- |
||
|
Mariculture Subzone |
F2 |
Depth average |
5.1 |
0.0192 |
4.4 |
0.0508 |
- |
- |
- |
|
Surface, Note 1 |
4.6 |
0.0156 |
4.5 |
0.0440 |
- |
- |
- |
||
|
Important Spawning Ground of Commercial Fisheries
Resources |
F3 |
Depth average |
4.4 |
0.0074 |
6.0 |
0.0155 |
- |
- |
- |
|
Observation
Points |
|||||||||
|
Oyster Culture Activities Outside Mariculture
Subzone |
O1 |
Depth average |
5.1 |
0.0660 |
4.4 |
0.0974 |
- |
- |
- |
|
O2 |
Depth average |
3.9 |
0.9752 |
4.1 |
1.2952 |
- |
- |
- |
|
|
O3 |
Depth average |
5.1 |
0.2282 |
4.4 |
0.9521 |
- |
- |
- |
|
Note:
1.
Five WSRs (E1, E2, E4, F1 and F2) are
located within the Mariculture Subzone where the WQO for DO is only available
for surface water layer. Predicted SS elevations for surface layer are
therefore included for these WSRs to provide information for the assessment of
DO depletion at the surface water layer for comparison with the WQO for DO.
2.
Locations of WSRs are shown in Figure
5.2 with corresponding ID.
3.
S3 is not included as there is no SS
criteria specified by the intake operator as mentioned in Section 5.6.2.2.2.
Table 5-16 Predicted
SS Elevations and Sedimentation Rates - Unmitigated Scenario A2
|
Description |
ID |
Water Depth |
Maximum SS Elevation
(mg/L) |
Maximum Sediment
Deposition (g/m2/day) |
|||||
|
Dry Season |
Wet Season |
Criteria |
Dry Season |
Wet Season |
|||||
|
Criteria |
Predicted Level |
Criteria |
Predicted Level |
||||||
|
Water
Sensitive Receivers |
|||||||||
|
Intake of T∙Park |
S1 |
Depth average |
117.1 |
2.0232 |
116.5 |
2.2962 |
- |
- |
- |
|
Intakes of BBPS |
S2a |
Depth average |
700 |
0.7956 |
700 |
0.6590 |
- |
- |
- |
|
S2b |
Depth average |
700 |
1.2561 |
700 |
1.0020 |
- |
- |
- |
|
|
Mudflat / Seagrass / Horseshoe Crab at Ha Pak Nai |
E1 |
Bottom |
5.7 |
0.0411 |
5.0 |
0.3063 |
100 |
1.133 |
9.977 |
|
Surface, Note 1 |
4.6 |
0.0186 |
4.5 |
0.2796 |
- |
- |
- |
||
|
Mudflat / Seagrass / Horseshoe Crab at Sheung Pak
Nai |
E2 |
Bottom |
5.7 |
<0.0001 |
5.0 |
0.0048 |
100 |
<0.001 |
0.156 |
|
Surface, Note 1 |
4.6 |
<0.0001 |
4.5 |
0.0042 |
- |
- |
- |
||
|
Sha Chau and Lung Kwu Chau
Marine Park |
E3 |
Depth average |
4.4 |
0.0127 |
6.0 |
0.0050 |
- |
- |
- |
|
Pai Nai SSSI |
E4 |
Depth average |
5.1 |
<0.0001 |
4.4 |
0.0039 |
- |
- |
- |
|
Surface, Note 1 |
4.6 |
<0.0001 |
4.5 |
0.0035 |
- |
- |
- |
||
|
Traditional Oyster
Production Area |
F1 |
Depth average |
5.1 |
<0.0001 |
4.4 |
0.0133 |
- |
- |
- |
|
Surface, Note 1 |
4.6 |
<0.0001 |
4.5 |
0.0116 |
- |
- |
- |
||
|
Mariculture Subzone |
F2 |
Depth average |
5.1 |
0.0552 |
4.4 |
0.0659 |
- |
- |
- |
|
Surface, Note 1 |
4.6 |
0.0458 |
4.5 |
0.0530 |
- |
- |
- |
||
|
Important Spawning Ground of Commercial Fisheries
Resources |
F3 |
Depth average |
4.4 |
0.0147 |
6.0 |
0.0140 |
- |
- |
- |
|
Observation
Points |
|||||||||
|
Oyster Culture Activities Outside Mariculture
Subzone |
O1 |
Depth average |
5.1 |
0.3770 |
4.4 |
0.4100 |
- |
- |
- |
|
O2 |
Depth average |
3.9 |
2.3998 |
4.1 |
2.1606 |
- |
- |
- |
|
|
O3 |
Depth average |
5.1 |
1.2693 |
4.4 |
1.1616 |
- |
- |
- |
|
Note:
1.
Five WSRs (E1, E2, E4, F1 and F2) are
located within the Mariculture Subzone where the WQO for DO is only available
for surface water layer. Predicted SS elevations for surface layer are
therefore included for these WSRs to provide information for the assessment of
DO depletion at the surface water layer for comparison with the WQO for DO.
2.
Locations of WSRs are shown in Figure
5.2 with corresponding ID.
3.
S3 is not included as there is no SS
criteria specified by the intake operator as mentioned in Section 5.6.2.2.2.
Full compliances for SS elevations and sedimentation rates are predicted at the WSRs and observation points under the unmitigated scenarios. The contour maps of SS elevations and sedimentation rates under the unmitigated scenarios are presented in Appendix 5G, which showed that the sediment plume would be localized. The SS elevations and sedimentation caused by the small-scale sand blanket laying work are considered insignificant and transient.
The contour maps in Appendix 5G illustrate that the sediment plume generated under Scenario A2 (due to sediment release at WAL) would disperse more towards the observation points (O1 to O3) as compared to the release at MAL under Scenario A1. Under Scenario A1, the sediment plume would disperse more to the east and to the west. Less sediment is therefore diffused towards the nearest observation points (O1 to O3) in the north.
Secondary contact recreation subzone is located within the assessment area and could involve water sports activities such as boating and sailing. These activities may involve direct water contact but the chance of swallowing the water is unlikely. Significant water quality impact upon the users of the secondary contact recreation subzone due to the transient SS increases is not anticipated.
Elevation of SS and
Sedimentation under Mitigated Scenarios
As a precautionary measure, a single layer of silt curtain is recommended to be deployed around the DCM and sand blanket laying works of this Project. As discussed in Section 5.5.1.7, a single layer of silt curtain would have a SS removal efficiency of 75%. The mitigated SS elevations and sedimentation rates with consideration of the silt curtain deployment would be further minimized as presented in Table 5-17 and Table 5-18.
Table 5-17 Predicted
SS Elevations and Sedimentation Rates - Mitigated Scenario A1
|
Description |
ID |
Water Depth |
Maximum SS Elevation
(mg/L) |
Maximum Sediment
Deposition (g/m2/day) |
|||||
|
Dry Season |
Wet Season |
Criteria |
Dry Season |
Wet Season |
|||||
|
Criteria |
Predicted Level |
Criteria |
Predicted Level |
||||||
|
Water
Sensitive Receivers |
|||||||||
|
Intake of T∙Park |
S1 |
Depth average |
117.1 |
1.711925 |
116.5 |
2.020525 |
- |
- |
- |
|
Intakes of BBPS |
S2a |
Depth average |
700 |
0.0887 |
700 |
0.1118 |
- |
- |
- |
|
S2b |
Depth average |
700 |
0.18475 |
700 |
0.134175 |
- |
- |
- |
|
|
Mudflat / Seagrass / Horseshoe Crab at Ha Pak Nai |
E1 |
Bottom |
5.7 |
0.04735 |
5.0 |
0.089075 |
100 |
1.277 |
2.872 |
|
Surface, Note 1 |
4.6 |
0.0259 |
4.5 |
0.08115 |
- |
- |
- |
||
|
Mudflat / Seagrass / Horseshoe Crab at Sheung Pak
Nai |
E2 |
Bottom |
5.7 |
<0.0001 |
5.0 |
0.0023 |
100 |
<0.001 |
0.076 |
|
Surface, Note 1 |
4.6 |
<0.0001 |
4.5 |
0.00205 |
- |
- |
- |
||
|
Sha Chau and Lung Kwu Chau
Marine Park |
E3 |
Depth average |
4.4 |
0.002 |
6.0 |
0.0009 |
- |
- |
- |
|
Pai Nai SSSI |
E4 |
Depth average |
5.1 |
<0.0001 |
4.4 |
0.002 |
- |
- |
- |
|
Surface, Note 1 |
4.6 |
<0.0001 |
4.5 |
0.001775 |
- |
- |
- |
||
|
Traditional Oyster
Production Area |
F1 |
Depth average |
5.1 |
<0.0001 |
4.4 |
0.007175 |
- |
- |
- |
|
Surface, Note 1 |
4.6 |
<0.0001 |
4.5 |
0.006125 |
- |
- |
- |
||
|
Mariculture Subzone |
F2 |
Depth average |
5.1 |
0.0048 |
4.4 |
0.0127 |
- |
- |
- |
|
Surface, Note 1 |
4.6 |
0.0039 |
4.5 |
0.011 |
- |
- |
- |
||
|
Important Spawning Ground of Commercial Fisheries
Resources |
F3 |
Depth average |
4.4 |
0.00185 |
6.0 |
0.003875 |
- |
- |
- |
|
Observation
Points |
|||||||||
|
Oyster Culture Activities Outside Mariculture
Subzone |
O1 |
Depth average |
5.1 |
0.0165 |
4.4 |
0.02435 |
- |
- |
- |
|
O2 |
Depth average |
3.9 |
0.2438 |
4.1 |
0.3238 |
- |
- |
- |
|
|
O3 |
Depth average |
5.1 |
0.05705 |
4.4 |
0.238025 |
- |
- |
- |
|
Note:
1.
Five WSRs (E1, E2, E4, F1 and F2) are
located within the Mariculture Subzone where the WQO for DO is only available
for surface water layer. Predicted SS elevations for surface layer are
therefore included for these WSRs to provide information for the assessment of
DO depletion at the surface water layer for comparison with the WQO for DO.
2.
Locations of WSRs are shown in Figure
5.2 with corresponding ID.
3.
S3 is not included as there is no SS
criteria specified by the intake operator as mentioned in Section 5.6.2.2.2.
Table 5-18 Predicted SS Elevations and Sedimentation Rates - Mitigated Scenario A2
|
Description |
ID |
Water Depth |
Maximum SS Elevation
(mg/L) |
Maximum Sediment
Deposition (g/m2/day) |
|||||
|
Dry Season |
Wet Season |
Criteria |
Dry Season |
Wet Season |
|||||
|
Criteria |
Predicted Level |
Criteria |
Predicted Level |
||||||
|
Water
Sensitive Receivers |
|||||||||
|
Intake of T∙Park |
S1 |
Depth average |
117.1 |
0.5058 |
116.5 |
0.57405 |
- |
- |
- |
|
Intakes of BBPS |
S2a |
Depth average |
700 |
0.1989 |
700 |
0.16475 |
- |
- |
- |
|
S2b |
Depth average |
700 |
0.314025 |
700 |
0.2505 |
- |
- |
- |
|
|
Mudflat / Seagrass / Horseshoe Crab at Ha Pak Nai |
E1 |
Bottom |
5.7 |
0.010275 |
5.0 |
0.076575 |
100 |
0.283 |
2.494 |
|
Surface, Note 1 |
4.6 |
0.00465 |
4.5 |
0.0699 |
- |
- |
- |
||
|
Mudflat / Seagrass / Horseshoe Crab at Sheung Pak
Nai |
E2 |
Bottom |
5.7 |
<0.0001 |
5.0 |
0.0012 |
100 |
<0.001 |
0.039 |
|
Surface, Note 1 |
4.6 |
<0.0001 |
4.5 |
0.00105 |
- |
- |
- |
||
|
Sha Chau and Lung Kwu Chau
Marine Park |
E3 |
Depth average |
4.4 |
0.003175 |
6.0 |
0.00125 |
- |
- |
- |
|
Pai Nai SSSI |
E4 |
Depth average |
5.1 |
<0.0001 |
4.4 |
0.000975 |
- |
- |
- |
|
Surface, Note 1 |
4.6 |
<0.0001 |
4.5 |
0.000875 |
- |
- |
- |
||
|
Traditional Oyster
Production Area |
F1 |
Depth average |
5.1 |
<0.0001 |
4.4 |
0.003325 |
- |
- |
- |
|
Surface, Note 1 |
4.6 |
<0.0001 |
4.5 |
0.0029 |
- |
- |
- |
||
|
Mariculture Subzone |
F2 |
Depth average |
5.1 |
0.0138 |
4.4 |
0.016475 |
- |
- |
- |
|
Surface, Note 1 |
4.6 |
0.01145 |
4.5 |
0.01325 |
- |
- |
- |
||
|
Important Spawning Ground of Commercial Fisheries
Resources |
F3 |
Depth average |
4.4 |
0.003675 |
6.0 |
0.0035 |
- |
- |
- |
|
Observation
Points |
|||||||||
|
Oyster Culture Activities Outside Mariculture
Subzone |
O1 |
Depth average |
5.1 |
0.09425 |
4.4 |
0.1025 |
- |
- |
- |
|
O2 |
Depth average |
3.9 |
0.59995 |
4.1 |
0.54015 |
- |
- |
- |
|
|
O3 |
Depth average |
5.1 |
0.317325 |
4.4 |
0.2904 |
- |
- |
- |
|
Note:
1.
Five WSRs (E1, E2, E4, F1 and F2) are
located within the Mariculture Subzone where the WQO for DO is only available
for surface water layer. Predicted SS elevations for surface layer are
therefore included for these WSRs to provide information for the assessment of
DO depletion at the surface water layer for comparison with the WQO for DO.
2.
Locations of WSRs are shown in Figure
5.2 with corresponding ID.
3.
S3 is not included as there is no SS
criteria specified by the intake operator as mentioned in Section 5.6.2.2.2.
Oxygen Depletion
The maximum Chemical Oxygen Demand (COD) of the sediment samples collected by EPD in 2022 at the outer Deep Bay (DS3 and DS4 as shown in Figure 5.2) was used to determine the reductions in Dissolved Oxygen (DO) concentration, based on the predicted increases in SS concentrations at the WSRs and observation points in accordance with the following equation:
DODEP = C * CODsed * K * 10-6
where DODEP = DO depletion (mg/L)
C = Predicted maximum SS concentration under mitigated scenario in Table 5-17 and Table 5-18
CODsed = Maximum COD in sediment (18,000 mg/kg) measured by EPD in 2022 at outer Deep Bay
K = Daily oxygen uptake factor (set as 1)
This approach is a highly conservative prediction since the sand material to be laid under the Project is uncontaminated. The daily oxygen uptake factor, K, is set to be 1, which implies instantaneous oxidation of the COD. This is also a very adverse prediction of DO depletion since oxygen depletion is not instantaneous. It is worth noting that the above equation does not account for re-aeration which tends to reduce the SS impacts on the DO concentrations.
The predicted DO results for ecological sensitive
receivers (E1 to E4), fisheries sensitive receivers (F1 to F3) and observation
points (O1 to O3) are tabulated in Table 5-19
and Table 5-20.
The seawater intakes (S1, S2a, S2b and S3) identified in the assessment area
are not sensitive to DO depletion and therefore not considered. The maximum DO
depletions predicted at all WSRs are <0.01 mg/L, which is considered
minimal. The maximum DO depletion amongst the observation points is about 0.01
mg/L, and the resulted DO levels fully complied with the WQO. No adverse DO
impact would arise from the Project construction.
Table 5-19 Predicted
DO Levels - Mitigated Scenario A1
|
Description |
ID |
Water
Depth |
DO mg/L |
|||
|
WQO
(10%ile) |
Ambient
Level (10%ile) |
Predicted
Maximum Depletion |
Resulted
Level |
|||
|
(A) |
(B) |
(C) |
(D) |
|||
|
Water
Sensitive Receivers |
||||||
|
Mudflat / Seagrass / Horseshoe Crab at Ha Pak Nai |
E1 |
Bottom |
NA |
4.33 |
0.0016 |
4.33 |
|
Surface |
≥ 5 |
4.73 |
0.0015 |
4.73 |
||
|
Mudflat / Seagrass / Horseshoe Crab at Sheung Pak
Nai |
E2 |
Bottom |
NA |
4.33 |
<0.0001 |
4.33 |
|
Surface |
≥ 5 |
4.73 |
<0.0001 |
4.73 |
||
|
Sha Chau and Lung Kwu Chau
Marine Park |
E3 |
Depth average |
≥ 4 |
4.29 |
<0.0001 |
4.29 |
|
Pai Nai SSSI |
E4 |
Depth average |
NA |
4.56 |
<0.0001 |
4.56 |
|
Surface |
≥ 5 |
4.73 |
<0.0001 |
4.73 |
||
|
Traditional Oyster
Production Area |
F1 |
Depth average |
NA |
4.56 |
0.0001 |
4.56 |
|
Surface |
≥ 5 |
4.73 |
0.0001 |
4.73 |
||
|
Mariculture Subzone |
F2 |
Depth average |
NA |
4.56 |
0.0002 |
4.56 |
|
Surface |
≥ 5 |
4.73 |
0.0002 |
4.73 |
||
|
Important Spawning Ground of Commercial Fisheries
Resources |
F3 |
Depth average |
≥ 4 |
4.29 |
<0.0001 |
4.29 |
|
Observation
Points |
||||||
|
Oyster Culture Activities Outside Mariculture
Subzone |
O1 |
Depth average |
≥ 4 |
4.56 |
0.0004 |
4.56 |
|
O2 |
Depth average |
≥ 4 |
4.47 |
0.0058 |
4.46 |
|
|
O3 |
Depth average |
≥ 4 |
4.56 |
0.0043 |
4.56 |
|
Notes:
(A) The
WQO for DO is a 10%ile value over the year. Five WSRs (E1, E2, E4, F1 and F2)
are located within Mariculture Subzone where the WQO for DO is available for
surface water layer only.
(B) The
ambient level is presented as 10%ile of the DO concentrations measured by EPD
at the closest stations during the period from 2018 to 2022.
(C) The
DO depletion is calculated using the maximum SS elevation over the dry and wet
season under the mitigated scenario in Table 5-17.
(D) The
resulted DO level = Column (B) - Column (C).
Table 5-20 Predicted
DO Levels - Mitigated Scenario A2
|
Description |
ID |
Water Depth |
DO mg/L |
|||
|
WQO
(10%ile) |
Ambient
Level (10%ile) |
Predicted
Maximum Depletion |
Resulted
Level |
|||
|
(A) |
(B) |
(C) |
(D) |
|||
|
Water
Sensitive Receivers |
||||||
|
Mudflat / Seagrass / Horseshoe Crab at Ha Pak Nai |
E1 |
Bottom |
NA |
4.33 |
0.0014 |
4.33 |
|
Surface |
≥ 5 |
4.73 |
0.0013 |
4.73 |
||
|
Mudflat / Seagrass / Horseshoe Crab at Sheung Pak
Nai |
E2 |
Bottom |
NA |
4.33 |
<0.0001 |
4.33 |
|
Surface |
≥ 5 |
4.73 |
<0.0001 |
4.73 |
||
|
Sha Chau and Lung Kwu Chau
Marine Park |
E3 |
Depth average |
≥ 4 |
4.29 |
<0.0001 |
4.29 |
|
Pai Nai SSSI |
E4 |
Depth average |
NA |
4.56 |
<0.0001 |
4.56 |
|
Surface |
≥ 5 |
4.73 |
<0.0001 |
4.73 |
||
|
Traditional Oyster
Production Area |
F1 |
Depth average |
NA |
4.56 |
0.0001 |
4.56 |
|
Surface |
≥ 5 |
4.73 |
0.0001 |
4.73 |
||
|
Mariculture Subzone |
F2 |
Depth average |
NA |
4.56 |
0.0003 |
4.56 |
|
Surface |
≥ 5 |
4.73 |
0.0002 |
4.73 |
||
|
Important Spawning Ground of Commercial Fisheries
Resources |
F3 |
Depth average |
≥ 4 |
4.29 |
<0.0001 |
4.29 |
|
Observation
Points |
||||||
|
Oyster Culture Activities Outside Mariculture
Subzone |
O1 |
Depth average |
≥ 4 |
4.56 |
0.0018 |
4.56 |
|
O2 |
Depth average |
≥ 4 |
4.47 |
0.0108 |
4.46 |
|
|
O3 |
Depth average |
≥ 4 |
4.56 |
0.0057 |
4.55 |
|
Notes:
(A) The
WQO for DO is a 10%ile value over the year. Five WSRs (E1, E2, E4, F1 and F2)
are located within Mariculture Subzone where the WQO for DO is available for
surface water layer only.
(B) The
ambient level is presented as 10%ile of the DO concentrations measured by EPD
at the closest stations during the period from 2018 to 2022.
(C) The
DO depletion is calculated using the maximum SS elevation over the dry and wet
season under the mitigated scenario in Table 5-18.
(D) The
resulted DO level = Column (B) - Column (C).
5.7.1.6.3 Summary
Provided that the good construction design measures and good site practices as recommended in Section 5.8.1.7 and Section 5.8.1.8 are properly followed, no adverse water quality impact is expected from the seawall modification / construction of berthing facility including the proposed DCM and sand blanket laying work.
5.7.2 Operational Phase
5.7.2.1 Discharges from Desalination Plant and Seawater Cooling System
5.7.2.1.1 Introduction
Four modelling scenarios, namely Scenario B1, Scenario B2, Scenario B3 and Scenario B4 were simulated to address the potential impacts due to the discharges of brine and spent cooling effluent as defined in Section 5.6.3.1.2 and Appendix 5F. The parameters of concern include TRC, salinity and temperature. The concurrent discharges from T∙PARK, BPPS and CPPS are also considered in the modelling for water quality impact assessment. To protect the health of the users of the secondary contact recreation subzone, an E. coli objective is specified for the subzone under the WPCO. Since the Project operation will not induce any E. coil or bacterial loading to the marine water and the transient users of the subzone are considered less sensitive to the TRC, salinity and water temperature increases, impact upon the secondary contact recreation subzone is not further assessed.
5.7.2.1.2
Total Residual Chorine (TRC)
The
predicted TRC levels for Scenarios B1, B2, B3 and B4 are tabulated in Table 5-21 and Table 5-22 for ecological and fisheries sensitive receivers (E1 to E4, F1
to F3) and observation points (O1 to O3). The seawater intakes (S1, S2a, S2b
and S3) identified in the assessment area are not sensitive to the TRC increase
and therefore not considered.
The maximum cumulative TRC levels predicted at the representative WSRs and observation points under all scenarios are 0.0016 mg/L (4-day average) and 0.0105 mg/L (1-hour average). which complied with the criteria of 0.0075 mg/L and 0.013 mg/L respectively. The model contour maps in Appendix 5H-1 showed that the average TRC plume sizes due to the cumulative effect of this Project and other concurrent projects under both alternative outfall options are localized. The TRC impact is considered acceptable.
Table 5-21 Predicted Maximum 4-day Average
TRC Levels
|
Description |
ID |
Water Depth |
Maximum 4-day Average
TRC (mg/L) |
||||||||
|
Scenario B1 Baseline Scenario
without I∙PARK2 |
Scenario B2 Impact Scenario with I∙PARK2 -
Outfall Option 1 |
Scenario B3 Impact Scenario with I∙PARK2 - Outfall Option 2 |
Scenario B4 Impact Scenario with I∙PARK2 - Outfall Option 3 |
||||||||
|
|
|
Dry Season |
Wet Season |
Dry Season |
Wet Season |
Dry Season |
Wet Season |
Dry Season |
Wet Season |
||
|
Assessment Criterion: |
0.0075 |
||||||||||
|
Water
Sensitive Receivers |
|||||||||||
|
Mudflat / Seagrass / Horseshoe Crab at Ha Pak Nai |
E1 |
Bottom |
<0.0001 |
<0.0001 |
<0.0001 |
<0.0001 |
<0.0001 |
<0.0001 |
<0.0001 |
<0.0001 |
|
|
Mudflat / Seagrass / Horseshoe Crab at Sheung Pak
Nai |
E2 |
<0.0001 |
<0.0001 |
<0.0001 |
<0.0001 |
<0.0001 |
<0.0001 |
<0.0001 |
<0.0001 |
||
|
Sha Chau and Lung Kwu Chau
Marine Park |
E3 |
Depth average |
<0.0001 |
<0.0001 |
<0.0001 |
<0.0001 |
<0.0001 |
<0.0001 |
<0.0001 |
<0.0001 |
|
|
Pak Nai SSSI |
E4 |
<0.0001 |
<0.0001 |
<0.0001 |
<0.0001 |
<0.0001 |
<0.0001 |
<0.0001 |
<0.0001 |
||
|
Traditional Oyster
Production Area |
F1 |
<0.0001 |
<0.0001 |
<0.0001 |
<0.0001 |
<0.0001 |
<0.0001 |
<0.0001 |
<0.0001 |
||
|
Mariculture Subzone |
F2 |
<0.0001 |
<0.0001 |
<0.0001 |
<0.0001 |
<0.0001 |
<0.0001 |
<0.0001 |
<0.0001 |
||
|
Important Spawning Ground of Commercial Fisheries
Resources |
F3 |
<0.0001 |
<0.0001 |
<0.0001 |
<0.0001 |
<0.0001 |
<0.0001 |
<0.0001 |
<0.0001 |
||
|
Observation
Points |
|||||||||||
|
Oyster Culture Activities Outside Mariculture
Subzone |
O1 |
Depth average |
<0.0001 |
0.0001 |
<0.0001 |
0.0001 |
0.0001 |
0.0002 |
0.0001 |
0.0002 |
|
|
O2 |
0.0008 |
0.0008 |
0.0008 |
0.0008 |
0.0016 |
0.0015 |
0.0012 |
0.0013 |
|||
|
O3 |
0.0002 |
0.0003 |
0.0002 |
0.0003 |
0.0005 |
0.0006 |
0.0004 |
0.0005 |
|||
Table 5-22 Predicted Maximum 1-hour Average
TRC Levels
|
Description |
ID |
Water Depth |
Maximum 1-hour Average
TRC (mg/L) |
|||||||
|
Scenario B1 Baseline Scenario
without I∙PARK2 |
Scenario B2 Impact Scenario with I∙PARK2 -
Outfall Option 1 |
Scenario B3 Impact Scenario with I∙PARK2 - Outfall Option 2 |
Scenario B4 Impact Scenario with I∙PARK2 - Outfall Option 3 |
|||||||
|
Dry Season |
Wet Season |
Dry Season |
Wet Season |
Dry Season |
Wet Season |
Dry Season |
Wet Season |
|||
|
Assessment Criterion: |
0.013 |
|||||||||
|
Water
Sensitive Receivers |
||||||||||
|
Mudflat / Seagrass / Horseshoe Crab at Ha Pak Nai |
E1 |
Bottom |
<0.0001 |
<0.0001 |
<0.0001 |
<0.0001 |
<0.0001 |
0.0002 |
<0.0001 |
0.0001 |
|
Mudflat / Seagrass / Horseshoe Crab at Sheung Pak
Nai |
E2 |
<0.0001 |
<0.0001 |
<0.0001 |
<0.0001 |
<0.0001 |
<0.0001 |
<0.0001 |
<0.0001 |
|
|
Sha Chau and Lung Kwu Chau
Marine Park |
E3 |
Depth average |
<0.0001 |
<0.0001 |
<0.0001 |
<0.0001 |
<0.0001 |
<0.0001 |
<0.0001 |
<0.0001 |
|
Pak Nai SSSI |
E4 |
<0.0001 |
<0.0001 |
<0.0001 |
<0.0001 |
<0.0001 |
<0.0001 |
<0.0001 |
<0.0001 |
|
|
Traditional Oyster
Production Area |
F1 |
<0.0001 |
<0.0001 |
<0.0001 |
<0.0001 |
<0.0001 |
<0.0001 |
<0.0001 |
<0.0001 |
|
|
Mariculture Subzone |
F2 |
0.0001 |
0.0002 |
0.0001 |
0.0002 |
0.0002 |
0.0003 |
0.0002 |
0.0002 |
|
|
Important Spawning Ground of Commercial Fisheries
Resources |
F3 |
<0.0001 |
<0.0001 |
<0.0001 |
<0.0001 |
<0.0001 |
<0.0001 |
<0.0001 |
<0.0001 |
|
|
Observation
Points |
||||||||||
|
Oyster Culture Activities Outside Mariculture
Subzone |
O1 |
Depth average |
0.0010 |
0.0014 |
0.0010 |
0.0014 |
0.0015 |
0.0023 |
0.0017 |
0.0023 |
|
O2 |
0.0059 |
0.0055 |
0.0059 |
0.0054 |
0.0103 |
0.0105 |
0.0082 |
0.0090 |
||
|
O3 |
0.0022 |
0.0028 |
0.0021 |
0.0026 |
0.0041 |
0.0043 |
0.0038 |
0.0042 |
||
5.7.2.1.3
Temperature
Ecological and Fisheries Sensitive Receivers
No thermal impact would arise under Scenario B2 with the use of air-cooled system. The predicted temperature elevations due to the once-through seawater cooling system under Scenarios B3 and B4 are tabulated in Table 5-23 for ecological and fisheries sensitive receivers (E1 to E4, F1 to F3) and observation points (O1 to O3) for comparison with the WQO of no more than 2 oC. Full WQO compliances are predicted at all WSRs and observation points. The maximum temperature rise in dry and wet seasons predicted at these WSRs and observation points is 1.1 oC. The model contour maps given in Appendix 5H-2 showed that the average thermal plume sizes induced by the Project would be localized. No adverse temperature impact is predicted.
Table 5-23 Predicted Temperature
Elevations
|
Description |
ID |
Water Depth |
Temperature Elevation (oC), Note (1) |
|||
|
Scenario B3 Impact
Scenario with I∙PARK2 -Outfall Option 2 |
Scenario B4 Impact
Scenario with I∙PARK2 -Outfall Option 3 |
|||||
|
Dry Season |
Wet Season |
Dry Season |
Wet Season |
|||
|
WQO: |
≤ 2 |
|||||
|
Water
Sensitive Receivers |
||||||
|
Mudflat / Seagrass / Horseshoe Crab at Ha Pak Nai |
E1 |
Bottom |
0.1 |
0.8 |
0.1 |
0.7 |
|
Mudflat / Seagrass / Horseshoe Crab at Sheung Pak
Nai |
E2 |
<0.1 |
0.2 |
<0.1 |
0.2 |
|
|
Sha Chau and Lung Kwu Chau
Marine Park |
E3 |
Depth average |
0.1 |
<0.1 |
0.1 |
<0.1 |
|
Pai Nai SSSI |
E4 |
<0.1 |
0.2 |
<0.1 |
0.2 |
|
|
Traditional Oyster
Production Area |
F1 |
<0.1 |
0.3 |
<0.1 |
0.2 |
|
|
Mariculture Subzone |
F2 |
0.4 |
0.3 |
0.3 |
0.2 |
|
|
Important Spawning Ground of Commercial Fisheries
Resources |
F3 |
0.1 |
<0.1 |
0.1 |
0.1 |
|
|
Observation
Points |
||||||
|
Oyster Culture Activities Outside Mariculture
Subzone |
O1 |
Depth average |
0.4 |
0.3 |
0.4 |
0.3 |
|
O2 |
1.0 |
0.8 |
1.1 |
0.7 |
||
|
O3 |
1.1 |
0.7 |
1.0 |
0.7 |
||
Note:
(1) Temperature
elevation represents the change in daily temperature range caused by this
Project (i.e. Scenario B3 over Scenario B1 for Outfall Option 2; and Scenario
B4 over Scenario B1 for Outfall Option 3). The maximum values of all predicted
changes over the simulation periods are presented in the table.
Seawater
Intake
The
mean and maximum temperature levels predicted under Scenario B3 and Scenario B4
at the seawater intake of T∙Park (S1) for dry and wet season are shown in Table 5-24 for comparison with its
target design level.
Table 5-24 Predicted Temperature
Levels at Seawater Intake of T∙Park
|
Season |
Temperature Level (oC) |
|||||
|
Scenario B1 Baseline Scenario
without I∙PARK2 |
Scenario B3 Impact Scenario with I∙PARK2 - Outfall Option 2 |
Scenario B4 Impact Scenario with I∙PARK2 - Outfall Option 3 |
||||
|
Mean |
Maximum |
Mean |
Maximum |
Mean |
Maximum |
|
|
Target Design
Level |
19.2 to 31 |
|||||
|
Dry Season |
13.9 |
16.1 |
14.2 |
17.0 |
14.1 |
17.8 |
|
Wet Season |
31.5 |
34.3 |
31.9 |
34.3 |
31.8 |
34.3 |
The maximum temperature predicted at the intake of T∙Park (S1) exceeded the target design value under all the
modelling scenarios including the baseline scenario without the Project. The
maximum temperature of 34.3 oC is
observed in the wet season for all three scenarios. The intake operation at T∙Park is not expected to be significantly affected by the
Project.
No temperature criteria are
available for the seawater intakes of BBPS and CPBS and therefore, these
intakes are not further considered.
5.7.2.1.4 Salinity
The predicted absolute and percentage
(%) changes of salinity levels induced by the brine discharge of this Project
for dry and wet seasons are tabulated in Table 5-25 and Table 5-26. The model outputs showing the mean salinity changes in dry
and wet seasons are provided in Appendix 5H-3.
Table
5-25 Predicted Salinity Changes
|
Description |
ID |
Water Depth |
Maximum Salinity Change (ppt) |
||||||
|
Scenario B2 Impact Scenario with I∙PARK2 Outfall Option 1 |
Scenario B3 Impact Scenario with I∙PARK2 Outfall Option 2 |
Scenario B4 Impact Scenario with I∙PARK2 Outfall Option 3 |
|||||||
|
Dry Season |
Wet Season |
Dry Season |
Wet Season |
Dry Season |
Wet Season |
||||
|
WQO |
N/A |
||||||||
|
Water Sensitive Receivers |
|||||||||
|
Mudflat / Seagrass / Horseshoe
Crab at Ha Pak Nai |
E1 |
Bottom |
<0.01 |
0.06 |
0.01 |
0.16 |
0.02 |
0.25 |
|
|
Mudflat / Seagrass /
Horseshoe Crab at Sheung Pak Nai |
E2 |
<0.01 |
0.05 |
<0.01 |
0.08 |
0.01 |
0.06 |
||
|
Sha Chau and Lung Kwu Chau
Marine Park |
E3 |
Depth average |
0.03 |
0.04 |
0.02 |
0.05 |
0.02 |
0.04 |
|
|
Pak Nai SSSI |
E4 |
<0.01 |
0.03 |
<0.01 |
0.08 |
0.01 |
0.06 |
||
|
Traditional Oyster
Production Area |
F1 |
<0.01 |
0.05 |
0.08 |
0.13 |
0.09 |
0.08 |
||
|
Mariculture Subzone |
F2 |
0.05 |
0.13 |
0.12 |
0.21 |
0.08 |
0.19 |
||
|
Important Spawning Ground of Commercial Fisheries
Resources |
F3 |
0.01 |
0.03 |
0.01 |
0.05 |
0.01 |
0.04 |
||
|
Observation
Points |
|||||||||
|
Oyster Culture Activities Outside Mariculture
Subzone |
O1 |
Depth average |
0.06 |
0.15 |
0.29 |
0.16 |
0.15 |
0.32 |
|
|
O2 |
0.12 |
0.26 |
0.50 |
0.52 |
0.39 |
0.42 |
|||
|
O3 |
0.05 |
0.10 |
0.32 |
0.35 |
0.22 |
0.27 |
|||
Note: Salinity change represents the change
in salinity level caused by this Project (i.e. Scenario B4 over Scenario B1 for
Outfall Option 1; Scenario B3 over Scenario B1 for Outfall Option 2; and
Scenario B4 over Scenario B1 for Outfall Option 3). The maximum values of all
predicted changes over the simulation periods are presented in the table.
Table 5-26 Predicted Percentage Salinity
Changes
|
Description |
ID |
Water Depth |
Maximum Salinity Change (%) |
||||||
|
Scenario B2 Impact Scenario with I∙PARK2 -Outfall
Option 1 |
Scenario B3 Impact Scenario with I∙PARK2 -Outfall
Option 2 |
Scenario B4 Impact Scenario with I∙PARK2 -Outfall
Option 3 |
|||||||
|
Dry Season |
Wet Season |
Dry Season |
Wet Season |
Dry Season |
Wet Season |
||||
|
WQO |
±10% |
||||||||
|
Water Sensitive Receivers |
|||||||||
|
Mudflat / Seagrass /
Horseshoe Crab at Ha Pak Nai |
E1 |
Bottom |
<1% |
<1% |
<1% |
1% |
<1% |
2% |
|
|
Mudflat / Seagrass /
Horseshoe Crab at Sheung Pak Nai |
E2 |
<1% |
<1% |
<1% |
<1% |
<1% |
<1% |
||
|
Sha Chau and Lung Kwu Chau
Marine Park |
E3 |
Depth average |
<1% |
<1% |
<1% |
<1% |
<1% |
<1% |
|
|
Pak Nai SSSI |
E4 |
<1% |
<1% |
<1% |
<1% |
<1% |
<1% |
||
|
Traditional Oyster
Production Area |
F1 |
<1% |
<1% |
<1% |
<1% |
<1% |
<1% |
||
|
Mariculture Subzone |
F2 |
<1% |
<1% |
<1% |
1% |
<1% |
1% |
||
|
Important Spawning Ground of Commercial Fisheries
Resources |
F3 |
<1% |
<1% |
<1% |
<1% |
<1% |
<1% |
||
|
Observation
Points |
|||||||||
|
Oyster Culture Activities Outside Mariculture
Subzone |
O1 |
Depth average |
<1% |
<1% |
<1% |
1% |
<1% |
2% |
|
|
O2 |
<1% |
2% |
2% |
3% |
1% |
3% |
|||
|
O3 |
<1% |
<1% |
1% |
2% |
<1% |
2% |
|||
Note: Salinity change represents the
change in salinity level caused by this Project (i.e. Scenario B4 over Scenario
B1 for Outfall Option 1; Scenario B3 over Scenario B1 for Outfall Option 2; and
Scenario B4 over Scenario B1 for Outfall Option 3), i.e. (salinity of Scenario
B2/B3/B4 - salinity of Scenario B1)/ salinity of Scenario B1 * 100%. The
maximum values of all predicted changes over the simulation periods are
presented in the table.
Full WQO compliances are predicted at all ecological and fisheries sensitive receivers (E1 to E4, F1 to F3). The maximum % increases predicted at the WSRs are no more than 3%, which compiled well with the WQO of no more than 10%. The seawater intakes (S1, S2a, S2b and S3) are not sensitive to the changes of salinity and therefore not considered.
With reference to the
contour maps given in Appendix 5H-3, average salinity change induced by
this Project is below 10% in the areas close to the Project site. Based on the
model prediction, the salinity impact of this Project is insignificant and
acceptable.
5.7.2.1.5 Sodium Metabisulphite
and Associated Oxygen Depletion
Where necessary, Sodium Metabisulphite
(SMBS) may be dosed in the desalination and seawater cooling systems. As a
measure to avoid damage to the membrane of the reverse osmosis (RO) unit of the
desalination plant, SMBS would be dosed in the seawater pre-treatment units
before reaching the RO unit for dechlorination.
Optimization of the dosage of TRC and SMBS would also be considered in the
detailed design of the desalination and seawater cooling system to minimize the
discharge of TRC and residual SMBS. The TRC and SMBS level in the discharges of
these systems is expected to be minimal. For conservative reason, the
assessment of Dissolved Oxygen (DO) depletion is based on an adverse assumption
that the residual level of SMBS in the effluent discharges would be 0.5 mg/L [30].
Tracer simulations were
performed by introducing an inert, non-settling tracer (with zero decay rate)
in the refined HK-DFM Model to represent the continuous release of SMBS. The
predicted SMBS concentrations at WSRs and observation points covering dry and
wet seasons under Scenarios B2 to B4 are tabulated in Table 5-27. The contour plots of mean
SMBS concentrations are shown in Appendix 5H-4. Taken into account the
molecular mass of SMBS and oxygen, 1 mg/L of SMBS would react with 0.16832 mg/L
of DO (assuming complete reaction). The resulted DO depletions at the relevant
WSRs are shown in Table 5-27. The predicted DO depletion
would be <0.01 mg/L. The potential DO impact due to any discharge of SMBS
would be minor. No adverse marine water quality impact would be
anticipated.
Table 5-27 Predicted
SMBS Concentrations and DO Levels
|
Description |
ID |
Water Depth |
Predicted Mean SMBS
Levels (mg/L) |
DO (mg/L) |
|
||||||||
|
Dry Season |
Wet Season |
WQO (10%ile) |
Ambient Level (10%ile) |
Predicted Depletion |
Resulted Level |
|
|||||||
|
Scenario B2 |
Scenario B3 |
Scenario B4 |
Scenario B2 |
Scenario B3 |
Scenario B4 |
||||||||
|
(A) |
(B) |
(C) |
(D) |
||||||||||
|
(i) |
(ii) |
(iii) |
(iv) |
(v) |
(vi) |
|
|||||||
|
Water
Sensitive Receivers |
|
||||||||||||
|
Mudflat / Seagrass / Horseshoe Crab at Ha Pak Nai |
E1 |
Bottom |
<0.0001 |
0.0097 |
0.0087 |
0.0001 |
0.0215 |
0.0194 |
NA |
4.33 |
0.0036189 |
4.33 |
|
|
Surface, Note 1 |
<0.0001 |
0.0095 |
0.0087 |
0.0001 |
0.0215 |
0.0194 |
≥ 5 |
4.73 |
0.0036189 |
4.73 |
|
||
|
Mudflat / Seagrass / Horseshoe Crab at Sheung Pak
Nai |
E2 |
Bottom |
<0.0001 |
0.0058 |
0.0059 |
<0.0001 |
0.0113 |
0.0111 |
NA |
4.33 |
0.001902 |
4.33 |
|
|
Surface, Note 1 |
<0.0001 |
0.0058 |
0.0059 |
<0.0001 |
0.0113 |
0.0111 |
≥ 5 |
4.73 |
0.001902 |
4.73 |
|
||
|
Sha Chau and Lung Kwu Chau
Marine Park |
E3 |
Depth average |
<0.0001 |
0.0043 |
0.0043 |
<0.0001 |
0.0032 |
0.0032 |
≥ 4 |
4.29 |
0.0007238 |
4.29 |
|
|
Pai Nai SSSI |
E4 |
Depth average |
<0.0001 |
0.0058 |
0.0059 |
<0.0001 |
0.0105 |
0.0103 |
NA |
4.56 |
0.0017674 |
4.56 |
|
|
Surface, Note 1 |
<0.0001 |
0.0058 |
0.0059 |
<0.0001 |
0.0105 |
0.0103 |
≥ 5 |
4.73 |
0.0017674 |
4.73 |
|
||
|
Traditional Oyster
Production Area |
F1 |
Depth average |
<0.0001 |
0.0063 |
0.0064 |
<0.0001 |
0.0118 |
0.0113 |
NA |
4.56 |
0.0019862 |
4.56 |
|
|
Surface, Note 1 |
<0.0001 |
0.0063 |
0.0063 |
<0.0001 |
0.0118 |
0.0114 |
≥ 5 |
4.73 |
0.0019862 |
4.73 |
|
||
|
Mariculture Subzone |
F2 |
Depth average |
<0.0001 |
0.0135 |
0.0132 |
<0.0001 |
0.0152 |
0.0150 |
NA |
4.56 |
0.0025585 |
4.56 |
|
|
Surface, Note 1 |
<0.0001 |
0.0126 |
0.0120 |
<0.0001 |
0.0141 |
0.0139 |
≥ 5 |
4.73 |
0.0023733 |
4.73 |
|
||
|
Important Spawning Ground of Commercial Fisheries
Resources |
F3 |
Depth average |
<0.0001 |
0.0042 |
0.0043 |
<0.0001 |
0.0036 |
0.0036 |
≥ 4 |
4.29 |
0.0007238 |
4.29 |
|
|
Observation
Points |
|||||||||||||
|
Oyster Culture Activities Outside Mariculture
Subzone |
O1 |
Depth average |
<0.0001 |
0.0181 |
0.0183 |
<0.0001 |
0.0138 |
0.0143 |
≥ 4 |
4.56 |
0.0030803 |
4.56 |
|
|
O2 |
Depth average |
0.0001 |
0.0351 |
0.0295 |
0.0001 |
0.0243 |
0.0225 |
≥ 4 |
4.47 |
0.005908 |
4.46 |
|
|
|
O3 |
Depth average |
0.0001 |
0.0334 |
0.0305 |
0.0001 |
0.0275 |
0.0258 |
≥ 4 |
4.56 |
0.0056219 |
4.55 |
|
|
Note:
1.
Five WSRs (E1, E2, E4, F1 and F2) are located
within the Mariculture Subzone where the WQO for DO is only available for
surface water layer. Predicted SMBS concentrations for surface layer are
therefore included for these WSRs to provide information for the assessment of
DO depletion at the surface water layer for comparison with the WQO for DO.
2.
The locations of WSRs are shown in Figure
5.2 with corresponding ID.
3.
The ambient DO level is presented as 10%ile
of the DO concentrations measured by EPD at the closest stations during the
period from 2018 to 2022.
4.
The DO depletion at each WSR is
calculated using the maximum SMBS value over Column (i)
to Column (vi) in the table.
5.
The resulted DO level = Column (B) -
Column (C).
5.7.2.2 Changes of Hydrodynamics and Water Quality
The predicted tidal flow
rates across the Outer Deep Bay during both dry and wet seasons are compared
between the baseline scenario without I∙PARK2 (Scenario B1) and
impact scenario with I∙PARK2 (Scenarios B2, B3 and B4) in Appendix 5I-1.
The model plots showed that there are no obvious changes in the instantaneous
tidal flow rates across the Deep Bay between the two scenarios.
The simulated surface flow vectors and depth-averaged flow speeds in the assessment area are also compared between the scenarios in Appendix 5I-2 and Appendix 5I-3. These plots show the instantaneous water movements at mid-ebb and mid-flood tides during both dry and wet seasons. No obvious changes of the predicted flow vectors and flow speeds in the assessment area are identified between the two simulated scenarios.
Since the predicted flow
regime are similar before and after the I∙PARK2 implementation, no
significant changes in the pollutant dispersion capacity and water quality in
the assessment area is expected.
The Project would not cause any adverse hydrodynamics and water quality impact.
5.7.2.3 Wastewater Generation - Option 1
Domestic sewage and process
wastewater are described in Section 5.5.2.4 above. Under Option 1, I∙PARK2 would be designed for
reuse of these wastewater streams for non-potable purposes. As illustrated in Appendix 5B,
two on-site wastewater treatment systems are tentatively proposed in I∙PARK2, namely high strength
wastewater treatment system and low strength wastewater treatment system
respectively.
5.7.2.3.1 High Strength Wastewater
Treatment System for Type 1 Wastewater
About
1,250 m3 of Type 1 wastewater would be generated from MSW handling
facilities and laboratory each day. All Type 1 wastewater would be diverted to
the on-site high strength wastewater treatment system for proper treatment. The tentative average dry
weather flow (ADWF) of the on-site high strength wastewater treatment system
would be about 1,500 m3/day. All the treated effluent from the high
strength wastewater system would be reused in the waste treatment processes
with no human contact. There would be no discharge of effluent from the high
strength wastewater treatment system into the environment under Option 1. The
effluent quality and treatment standards for reuse within the waste treatment
process would be subject to the detailed design.
5.7.2.3.2 Low Strength
Wastewater Treatment System for Type 2 Wastewater
About 80 m3 of
domestic sewage and washed water from workshop (i.e. Type 2 wastewater) would
be generated from the Project each day. All Type 2 wastewater would be diverted
to the on-site low strength wastewater treatment system for proper treatment.
The on-site low strength wastewater treatment system would have a tentative
ADWF of about 100 m3/day. All treated effluent from the low strength
wastewater treatment system would meet the WSD’s “Water Quality Standards for
Treated Grey Water and Rainwater Effluent” and would be reused on-site (with
possible human contact) such as toilet flushing and road washing. The relevant
water quality standards of the treated effluent are presented in Table 5-10. There would be no
discharge of effluent from the low strength wastewater treatment system into
the environment under Option 1.
5.7.2.3.3 Type 3 Wastewater
The remaining wastewater
generated from the treatment processes (i.e. Type 3 wastewater) such as boiler
blowdown water would have low or nil pollution level. The estimated quantity of
Type 3 wastewater is 1,670 m3/day. It would be reused directly
within the treatment processes and would not be discharged into the
environment. No treatment of Type 3 wastewater is proposed under Option 1.
5.7.2.3.1
Potential Water Quality Impact
No discharge of Type 1, Type
2 and Type 3 wastewater into the environment is proposed. The generation of
Type 1, Type 2 and Type 3 wastewater would not cause any water quality impact.
Suitable mitigation and
design measures would be implemented for the on-site wastewater treatment
system to prevent emergency discharge. Backup power supply in the form of dual
power supply or ring main supply or emergency generator(s) as well as standby
main treatment units and standby equipment parts / accessories would be
provided for the on-site wastewater treatment facilities including the high
strength wastewater treatment system and low strength wastewater treatment
system. Regular maintenance and checking of all on-site wastewater treatment
facilities as well as conveying facilities would be carried out to prevent
equipment and pipe failure. No submarine emergency discharge outfall is
proposed under this Project. The future plant operators will develop an
Emergency Response Plan (ERP) to deal with emergency scenario. An outline of
the ERP is presented in Section 5.8.2.2.
Any effluent discharges from the I∙PARK2 should be pre-treated to comply with the WPCO requirements, and sited away from the natural water streams. Provided that the good practices outlined in Section 5.8.2.2 for handling, treatment and disposal of operational stage effluent are properly observed and followed, no adverse water quality impact would arise from the sewage / wastewater generation.
5.7.2.4 Wastewater Generation - Option 2
The major point source
discharges at Urmston Road Submarine Outfall include the Upgraded San Wai
Sewage Treatment Works (Upgraded SWSTW), commissioned in 2021 with design
capacity of 200,000 m3/day and the proposed Hung Shui Kiu
Effluent Polishing Plant (HSKEPP), anticipated to commence by 2031, according
to the approved EIA for HSKEPP (AEIAR-240/2022, Scenario 2). I∙PARK2 is expected to be
commissioned in early 2030s. For this option, the proposed wastewater treatment
plant of I∙PARK2 will be equipped with at least secondary treatment plus
nitrogen removal and disinfection to achieve a very high level of pollution
load reduction (including at least 99% reduction of BOD5, ammonia
and E.coli, 98% reduction of COD and 96% reduction of TN, etc.) such
that the treated effluent would be suitable for discharge to the North-western
waters via a submarine outfall. The discharge of 3,000 m3/day of
treated effluent from I∙PARK2 will be made to the Urmston Road Submarine
Outfall, constituting only about 1% of the total effluent discharge flow of
293,000 m3/day from the outfall. The Project effluent would be
effectively diluted and further dispersed by the large volume of receiving
water and strong tidal current in Urmston Road Fairway, with an initial
dilution factor of 131 according to approved EIA for HSKEPP (AEIAR-240/2022).
For discharge of the treated effluent, the I∙PARK2 contractor shall
obtain a discharge licence under the WPCO and comply with the corresponding
effluent quality requirements with reference to the TM-DSS..
With secondary treatment
plus nitrogen removal and disinfection, the concentration of BOD5
and ammonia of the I∙PARK2 treated effluent will be much less than the
upgraded SWSTW (which adopts chemically enhanced primary treatment) and
comparable to the HSKEPP. Although the COD and TN concentration is higher than
the upgraded SWSTW, the total pollution loading for BOD5, COD and TN
for the Urmston Road Outfall would still be lower than the original SWSTW base
case, as detailed in Table 5-28. According to the model prediction in
the approved EIA for HSKEPP (AEIAR-240/2022), the bottom and depth averaged DO
level at the nearest water quality monitoring stations (i.e. NM5 and DM5) would
remain largely unchanged as shown in Table 5-29 despite an 11%
reduction in both BOD5 and COD loads from Scenario 1 to Scenario 2
as shown in Table 5-28. Given the total BOD5 and COD
loads in the current scenario are within the range of those assessed in the
approved EIA for HSKEPP, it is expected that the treated
effluent from I∙PARK2 in the current
scenario would not cause notable DO depletion in the
receiving water.
Similar
observation can be made for TIN. Despite a reduction of 8% in the TN load from Scenario 1 to Scenario
2 assessed in the approved EIA for HSKEPP (Table 5-28), the TIN concentration at NM5 and
DM5 in the receiving water remain largely unchanged (Table 5-29).
Hence, with the current scenario of 6% reduction in the TN load which is within
the range of those assessed in the approved EIA for HSKEPP, it is expected that
the treated effluent from I∙PARK2 in the current scenario would not cause
notable change in TIN in the receiving water. Provided that the I∙PARK2 Contractor complies
with the WPCO licence requirements, no adverse water quality impact arising
from treated effluent discharge from I∙PARK2 at Urmston Road Submarine
Outfall is expected.
Table 5-28 Major Point Source Discharges at Urmston Road
Submarine Outfall
|
|
HSKEPP EIA Study a |
Current
Scenario (Upgraded SWSTW
under Proposed Design + HSKEPP + |
||
|
Scenario
1 (Base
Case - Upgraded SWSTW under Original Design) |
Scenario
2 (Upgraded
SWSTW + HSKEPP under Proposed Design) |
|||
|
Flow
(m3/d) |
SWSTW |
246,000 |
200,000 |
200,000 |
|
HSKEPP |
0 |
90,000 |
90,000 |
|
|
I∙Park 2 |
0 |
0 |
3,000 |
|
|
Total |
246,000 |
290,000 |
293,000 |
|
|
Load
(kg/d) b |
BOD5 |
24,600 |
21,800
(-11%) |
21,950 (-11%) |
|
COD c |
49,200 |
43,600
(-11%) |
46,000
(-7%) |
|
|
TN |
8,315 |
7,660
(-8%) |
7,810
(-6%) |
|
Notes:
a.
Hung
Shui Kiu Effluent Polishing Plant EIA Report (AEIAR-240/2022) [Ref.
Table 5.13, https://www.epd.gov.hk/eia/register/report/eiareport/eia_2812022/EIA%20Report/S5_Water_Qaulity.htm#_Toc102731946]
b.
The
percentage changes of the loads compared to Scenario 1 are shown in brackets.
c.
COD
concentration of the effluent from SWSTW and HSKEPP is assumed to be 2 times
the BOD5 concentration with reference to Table 3-16 Typical
composition of untreated domestic wastewater in Metcalf & Eddy (1991)
Wastewater Engineering (Third Edition).
d.
Both
BOD5 and TN concentration of the effluent from I∙PARK2
are made reference to the TM-DSS.
e.
The
inclusion of the pollution load from treated effluent discharge from the WENT
Landfill and its extension (also via Urmston Road Submarine Outfall) into the
Study Scenario is found to be within the maximum total load assessed in the
Base Case Scenario 1 of the approved EIA of HSKEPP with no notable change in DO
and TIN in the receiving waters
Table 5-29 Predicted Water Quality at EPD’s Routine Monitoring
Stations near Urmston Road Submarine Outfall (extracted from HSKEPP EIA Study)
|
Parameter [WQO] a |
Monitoring Station |
HSKEPP EIA Study b |
||
|
Scenario 1 (Base Case) |
Scenario 2 (Upgraded SWSTW + HSKEPP) |
Change (Scenario 2 - Scenario 1) |
||
|
10%-tile Bottom DO [≥2] (mg/L) |
NM5 |
4.23 |
4.25 |
0.02 |
|
DM5 |
4.31 |
4.31 |
0 |
|
|
10%-tile Depth-averaged DO [≥4] (mg/L) |
NM5 |
4.45 |
4.45 |
0 |
|
DM5 |
4.59 |
4.59 |
0 |
|
|
TIN [≤0.5] (mg/L) |
NM5 |
0.69 |
0.69 |
0 |
|
DM5 |
0.80 |
0.79 |
-0.01 |
|
Notes:
a.
Annual data
is used in the calculation.
b.
Hung
Shui Kiu Effluent Polishing Plant EIA Report (AEIAR-240/2022) [Ref.
Appendix 5.7, https://www.epd.gov.hk/eia/register/report/eiareport/eia_2812022/EIA%20Report/S5_Water_Qaulity.htm#_Toc102731946]
5.7.2.5 Non-point Source Surface Runoff
Potential water quality impact
may arise from contaminated surface runoff during operational phase. The
footprint of the I∙PARK2 site is approximately 20.1 hectares (201,000 m2).
Most of the MSW reception and treatment processes, and MSW related
contaminating sources / activities of the Project will be either fully enclosed
or covered within buildings. Rainwater generated on building roof top would be uncontaminated and
harvested for beneficial uses on-site. For those uncovered areas as discussed in Section 5.5.2.5 including the MSW container
handling area and MSW truck delivery route, the first flush of potentially
contaminated surface runoff would be intercepted and conveyed to the on-site
wastewater treatment system. The remaining open site areas in I∙PARK2 of
approximately 8.7 hectares (87,000 m2) would be connected to the
storm drains and would be considered in the assessment of non-point source
surface runoff.
It is considered that only
rainfall events of sufficient intensity and volume would give rise to runoff.
The rainfall data obtained from the Hong Kong Observatory in the period from
2019 to 2023 were analysed to estimate the runoff percentage and average daily
runoff value (mm / day) in each month over the year. The storm catchment area
within I∙PARK2 site is expected to comprise both paved and landscaped
surface areas. It is conservatively assumed that the entire storm catchment
area would be impermeable with a runoff coefficient of 1.0. The monthly average
daily runoff values (mm / day) are then applied to the storm catchment area to
give the average daily volumes of non-point source surface runoff. The highest
daily runoff volume generated from I∙PARK2 would occur in June / September with a monthly
average value of 1,239 m3/day. Details of the calculations are
presented in Appendix 5J. It is anticipated that with proper
implementation of best management practices as recommended in Section 5.8.2.3, no adverse water quality
impact from non-point source surface runoff is expected.
5.8.1
Construction Phase
5.8.1.1 Construction Site Runoff and Dust Suppression Sprays
The site practices outlined in ProPECC PN 2/23 “Construction Site Drainage” should be followed where applicable to minimize surface runoff and the chance of erosion. Surface runoff including the spent effluent from dust suppression from construction sites should be discharged into storm drains via adequately designed sand/silt removal facilities such as sand traps, silt traps and sedimentation basins. Channels or earth bunds or sandbag barriers should be provided on site to properly direct stormwater to such silt removal facilities. Perimeter channels at site boundaries should be provided on site boundaries where necessary to intercept storm runoff from outside the site so that it will not wash across the site. Catchpits and perimeter channels should be constructed in advance of construction and earthworks.
Silt removal facilities, channels and manholes should be maintained and the deposited silt and grit should be removed regularly, at the onset of and after each rainstorm to prevent local flooding. Before disposal at the public fill reception facilities, the deposited silt and grit should be solicited in such a way that it can be contained and delivered by dump truck instead of tanker truck. Any practical options for the diversion and re-alignment of drainage should comply with both engineering and environmental requirements in order to provide adequate hydraulic capacity of all drains. Minimum distance of 100m should be maintained between the discharge points of construction site runoff and the nearby seawater intakes.
Construction works should be programmed to minimize soil/PFA excavation works in rainy seasons (April to September). If excavation in soil/PFA cannot be avoided in these months or at any time of year when rainstorms are likely, for the purpose of preventing soil/PFA erosion, temporary exposed slope surfaces should be covered e.g. by tarpaulin, and temporary access roads should be protected by crushed stone or gravel, as excavation proceeds. Intercepting channels should be provided (e.g. along the crest / edge of excavation) to prevent storm runoff from washing across exposed soil/PFA surfaces. Arrangements should always be in place in such a way that adequate surface protection measures can be safely carried out well before the arrival of a rainstorm.
Earthworks final surfaces should be well compacted and the subsequent permanent work or surface protection should be carried out immediately after the final surfaces are formed to prevent erosion caused by rainstorms. Appropriate drainage like intercepting channels should be provided where necessary.
Measures should be taken to minimize the ingress of rainwater into trenches. If excavation of trenches in wet seasons is necessary, they should be dug and backfilled in short sections. Rainwater pumped out from trenches or foundation excavations should be discharged into storm drains via silt removal facilities.
Construction materials (e.g. aggregates, sand and fill material) on sites should be covered with tarpaulin or similar fabric during rainstorms. Measures should be taken to prevent the washing away of construction materials, soil, silt or debris into any drainage system or nearby water environment. The excavated PFA should be backfilled as soon as possible, and stockpiles of the excavated PFA shall be covered with tarpaulin or similar fabric during rainstorms.
Manholes (including newly constructed ones) should always be adequately covered and temporarily sealed so as to prevent silt, construction materials or debris from getting into the drainage system.
5.8.1.2 Wastewater from General Land-based Construction Activities
5.8.1.2.1
General
The mitigation measures as outlined in ProPECC PN 2/23 “Construction Site Drainage” for control of various types of discharges and wastewater generated in the construction site should be observed and adopted where applicable.
5.8.1.2.2
Boring and Drilling Water
Water used in ground boring and drilling for site investigation or rock / soil anchoring should as far as practicable be re-circulated and reused after sedimentation. When there is a need for final disposal, the wastewater should be discharged into storm drains via silt removal facilities. The treated discharges shall meet the respective effluent standards applicable to the receiving waters as set out in the TM-DSS.
5.8.1.2.3
Wheel Washing Water
All vehicles and plant should be cleaned before they leave a construction site to minimize the deposition of earth, mud, debris on roads. A wheel washing bay should be provided at every site exit. Wash-water should have sand and silt settled out or removed for re-circulation or reuse as far as practicable. Any surplus treated wash-water should be discharged into storm drains. The treated discharges shall meet the respective effluent standards applicable to the receiving waters as set out in the TM-DSS. The section of construction road between the wheel washing bay and the public road should be paved with backfall to reduce vehicle tracking of soil and to prevent site runoff from entering public road drains.
5.8.1.3 General Refuse
It is recommended to clean the construction sites on a regular basis. Good site practices should be adopted to remove rubbish, debris and litter from construction sites so as to prevent the rubbish and litter from spreading from the site area. All general refuse generated on-site should be stored in enclosed bins or compaction units separately from C&D material. A reputable waste collector should be employed to remove general refuse from the site, separately from C&D material, on a regular basis to an approved landfill. An enclosed and covered area should be provided to reduce the occurrence of “windblown” light material.
5.8.1.4 Licensing of Construction Site Discharge
There
is a need to apply to EPD for a discharge license for discharge of effluent
from the construction site under the WPCO. All the runoff and
wastewater generated from the works areas should be treated and the effluent
discharge quality should meet the requirements specified in the discharge
license and follow the TM-DSS. The beneficial uses of the
treated effluent for other on-site activities such as dust suppression,
wheel washing and general cleaning etc., can minimize water consumption and
reduce the effluent discharge volume. If monitoring of the treated
effluent quality from the works areas is required during the construction phase
of the Project, the monitoring should be carried out in accordance with the
relevant WPCO license.
5.8.1.5 Accidental Chemical Spillage
Contractor must register as a chemical waste producer if chemical wastes would be produced from the construction activities. The Waste Disposal Ordinance (Cap 354) and its subsidiary regulations in particular the Waste Disposal (Chemical Waste) (General) Regulation, should be observed and complied with for control of chemical wastes.
Any service shop and maintenance facilities should be located on hard standings within a bunded area, and sumps and oil interceptors should be provided. Maintenance of vehicles and equipment involving activities with potential for leakage and spillage should only be undertaken within the areas appropriately equipped to control these discharges.
Disposal of chemical wastes should be carried out in compliance with the Waste Disposal Ordinance. The Code of Practice on the Packaging, Labelling and Storage of Chemical Wastes published under the Waste Disposal Ordinance details the requirements to deal with chemical wastes. General requirements are given as follows:
n Suitable containers should be used to hold the chemical wastes to avoid leakage or spillage during storage, handling and transport.
n Chemical waste containers should be suitably labelled, to notify and warn the personnel who are handling the wastes, to avoid accidents.
n Storage area should be selected at a safe location on site and adequate space should be allocated to the storage area.
5.8.1.6 Sewage Effluent from Construction Workforce
It is recommended to provide sufficient chemical toilets in the works areas. A licensed waste collector should be deployed to maintain the chemical toilets on a regular basis.
Notices should be posted at conspicuous locations to remind the workers not to discharge any sewage or wastewater into the surrounding environment. Regular environmental audit of the construction site should be undertaken to provide an effective control of any malpractices and to encourage continual improvement of environmental performance on site.
5.8.1.7 Seawall Modification and Construction of Permanent Berthing Facility
The following design and mitigation measures should be adopted for the seawall modification and construction of the berthing facility.
n Adopt non-dredged method (i.e. DCM treatment) for construction of the foundation for the proposed seawall modification / berthing facility.
n Place sand blanket of at least 1 m thick on top of the sediments prior to DCM treatment to avoid seabed sediment disturbance and release of fines.
n Carefully control the cement slurry injection pressure to prevent leaching out of cement slurry during the DCM operation.
n Control the production rate of the marine sand blanket laying to no more than 3,000 m3 per day.
n Silt curtain shall be deployed during the marine sand blanket laying and DCM operation.
n No open dumping method should be used for the sand blanket laying in marine water.
n Adopt a “controlled
bottom placement” method for the sand blanket laying work by releasing the sand
material at a point near the seabed (by closed grab dredger or other
appropriate method) and at a controlled sand filling rate to prevent localized
overloading of the seabed and potential instability, and to minimize loss of
fines when placing the sand blanket in marine water.
5.8.1.8 Good Site Practices for Construction Vessels
The following good site practices should be implemented to minimize water pollution from construction vessels and marine transportation of construction materials.
n Barges or hoppers shall not be filled to a level which will cause overflow of materials or pollution of water during loading or transportation.
n Excess materials shall be cleaned from the decks and exposed fittings of barges before the vessels are moved.
n Plants should not be operated with leaking pipes and any pipe leakages shall be repaired quickly.
n Adequate freeboard shall be maintained on barges to reduce the likelihood of decks being washed by wave action.
n All vessels should be sized so that adequate clearance is maintained between vessels and the seabed in all tide conditions, to ensure that undue turbidity is not generated by turbulence from vessel movement or propeller wash.
n The works shall not cause foam, oil, grease, litter or other objectionable matter to be present in the water within and adjacent to the works site.
5.8.2 Operational Phase
5.8.2.1 Discharges from Desalination Plant and Seawater Cooling System and Changes of Hydrodynamics and Water Quality
No adverse hydrodynamics and water quality impact is predicted from the discharges of desalination plant and seawater cooling system as well as due to the operation of the new berthing facility along the shore of Middle Ash Lagoon. All the discharges from desalination plant and seawater cooling system shall be controlled by the discharge licence issued under the WPCO. The discharge quality must meet the requirements specified in the discharge license. No mitigation measures are therefore required.
5.8.2.2 Control of Other Operational Site Effluents
The practices outlined in ProPECC PN 1/23 “Drainage Plan subject to Comments by Environmental Protection Department” should be adopted where applicable for handling, treatment and disposal of operational stage effluent. Specific site effluent control measures for I∙PARK2 are highlighted as follows for consideration in the detailed design stage.
5.8.2.2.1
Wastewater Management Measures - Option 1
n Type 1 wastewater such as leachate
with high organic loading should be discharged to the on-site high strength
wastewater treatment facility for treatment and the treated effluent shall be
reused on-site as process water with no human contact.
n Type 2 wastewater such as domestic
sewage should be discharged to the on-site low strength wastewater treatment
facility for treatment and the treated effluent shall meet the water quality
standards specified in the “Technical Specifications on Grey Water Reuse and
Rainwater Harvesting” issued by the WSD for beneficial reuse with possible
human contact, such as irrigation, toilet flushing and washing (e.g. road
washing).
n Type 3 wastewater with low / negligible pollution loading (e.g. boiler blowdown
water) should be directly reused on-site as process water with no human
contact.
5.8.2.2.2
Wastewater Management Measures - Option 2
Wastewater generated from I∙PARK2 shall be discharged to the on-site wastewater treatment system for proper treatment prior to discharging to the Urmston Road Submarine Outfall. A discharge licence for discharge of effluent from I∙PARK2 shall be applied under the WPCO. The quality of effluent discharged from I∙PARK2 shall meet the requirements specified in the discharge licence. With reference to the requirements stipulated in Annex 6 of EIAO-TM for effluent discharge into the NW WCZ, secondary treatment plus nitrogen removal and disinfection shall be adopted for the on-site wastewater treatment system under the Option 2.
5.8.2.2.3
Site Effluent Control Measures for Option 1 and Option 2
n MSW / ash handling and treatment areas should be located within
buildings or covered areas to prevent the generation of contaminated rainwater
runoff.
n All wastewater (e.g. washing down from the waste reception facilities) collected by drainage outlets provided in covered areas should be discharged to the on-site wastewater treatment facility for treatment.
n Backup power supply
in the form of dual power supply or ring main supply or emergency generator(s)
should be provided for all on-site wastewater treatment facilities and
rainwater reuse treatment system to secure electricity supply.
n Regular maintenance
and checking of all on-site wastewater treatment facilities and rainwater reuse
treatment system as well as conveying facilities should be carried out to
prevent equipment and pipe failure.
n Standby main
treatment units and standby equipment parts / accessories should be provided
for all on-site wastewater treatment facilities and rainwater reuse treatment
system to prevent the occurrence of plant failure.
n Any effluent
discharges from the I∙PARK2 should be pre-treated to comply with the WPCO
requirements, and sited away from the natural water streams.
n The harvested roofing rainwater shall be collected and treated by the rainwater reuse treatment facilities provided on-site and the treated effluent shall meet the water quality standards specified in the “Technical Specifications on Grey Water Reuse and Rainwater Harvesting” issued by the WSD for beneficial reuse with possible human contact (e.g. irrigation, toilet flushing and washing).
An Emergency Response Plan (ERP) should be developed by the future operators of the on-site wastewater treatment systems to deal with emergency situations caused by malfunctioning of the on-site wastewater treatment systems. The ERP should cover the following information:
n Programme of daily or
regular integrity checking of the on-site wastewater treatment and conveying
systems to inspect malfunctions.
n Details of best
management practices and maintenance programme of the on-site wastewater
treatment and conveying systems.
n Details of design and
operation of backup power supply as well as the duty and standby treatment
facilities of suitable capacities for emergency replacement.
n Emergency response
and rectification procedures to initiate emergency repairs, restore normal
operation of the on-site wastewater treatment systems and other preventive
measures such as the provision of temporary wastewater holding facility and /
or alternative treatment facility where appropriate to avoid emergency
discharge.
n List of contact
information including the names and contact information of key personnel and
their responsibilities in the ERP.
The ERP should be submitted to the EPD for approval before commencement of the operation.
5.8.2.3 Non-point Source Surface Runoff
Mitigation measures for
non-point source surface runoff (as listed below) are recommended for the
Project.
5.8.2.3.1 Design Measures
n Exposed surface shall be avoided within the proposed Project site to minimize soil erosion. Development site shall be either hard paved or covered by landscaping area where appropriate to reduce soil erosion.
n The drainage system of the Project should be designed to avoid any case of
flooding.
5.8.2.3.2 Surface Runoff
Control Measures
n Screening facilities
such as standard gully grating and trash grille, with spacing which is capable
of screening off large substances such as fallen leaves and
rubbish should be provided at the inlet of drainage system.
n A low flow
interceptor drainage system shall be deployed at uncovered paved areas within
the Project site for handling / delivery of MSW containers and MSW delivery
trucks to intercept and convey the first flush of any potentially contaminated
surface runoff to the on-site
wastewater treatment facility for treatment.
n Roofing rainwater
would be harvested and treated for beneficial reuse with possible human contact
(see Section 5.8.2.2).
n Surface runoff from
uncovered paved and development areas within the Project site (except the first
flush and roofing rainwater) should be discharged to stormwater drains after
removal of the particles by appropriate facilities (e.g. road gullies with standard
design and silt traps,).
5.8.2.3.3 Administrative
Measures
n Good management
measures such as regular cleaning and sweeping of road surface / open areas is
proposed. The road surface / open area cleaning should also be carried out
prior to occurrence of rainstorm.
n Manholes, as well as
storm water gullies, ditches provided among the development areas should be
regularly inspected and cleaned (e.g. monthly). Additional inspection and
cleansing should be carried out before forecast heavy rainfall.
According to Section 2, “West New Territories Landfill Extension” (WENTX)
would
be constructed and operated concurrently with the Project.
5.9.1 Construction Phase
5.9.1.1 Land-based Impact
The WENTX would construct / operate concurrently with the Project construction during 2026 to early 2030s. According to the approved EIA Report for WENTX (AEIAR-147/2009) and Supporting Document for Variation of Environmental Permit for the WENTX in 2022, potential water quality impact due to construction and operation of the WENTX would be minimized with proper implementation of the recommended mitigation measures and good site practices.
As no significant water quality impact was expected from the Project and WENTX during construction phase, no adverse cumulative water quality impact would be anticipated.
5.9.1.2 Marine-based Impact
The Modification of Tsang Kok Stream Outfall under the proposed WENT Landfill Extension would be commenced tentatively in 2024. The marine construction work under the proposed WENT Landfill Extension is anticipated to be substantially completed before the commencement of the marine construction work of I∙PARK2. No cumulative water quality impact arising from marine construction work is therefore predicted.
5.9.2 Operational Phase
The WENTX would construct / operate concurrently with the Project operation. According to the approved EIA report (AEIAR-147/2009) and Supporting Document for Variation of Environmental Permit for the WENTX in 2022, with the implementation of suitable mitigation measures and good site practices, adverse water quality impact would not be expected from the WENTX. Based on the findings of this EIA, with all the recommended mitigation measures in place, no significant water quality impact would be expected from the construction and operation of I∙PARK2. Therefore, I∙PARK2 would not cause adverse cumulative water quality impact with the WENTX project.
No discharge of treated or untreated process waters, domestic sewage and first flush into the Deep Bay is proposed under this Project. The only discharges to Deep Bay from the Project would be the brine from the proposed desalination plant and the spent effluent from the proposed seawater cooling system. The background seawater cooling effluent from BPPS and CPPS as well as the brine discharge from T∙PARK has been estimated and included in the modelling exercise for cumulative impact assessment. The model predicted that the Project discharges would not contribute any adverse cumulative water quality impact. The Project effluent discharge at Urmston Road Submarine Outfall in NW WCZ under Option 2 has also been assessed in Section 5.7.2.4 to cause no adverse cumulative water quality impact with other concurrent discharges.
With proper implementation of the recommended BMPs for stormwater discharge, any water quality impact arising from the non-point source surface runoff generated in the Project site would be highly localized or minimal and would not contribute any adverse cumulative water quality impact.
With proper implementation of all the recommended mitigation measures, no residual water quality impact is expected in construction and operational phases.
5.11.1 Construction Phase
Marine water quality monitoring is recommended to be carried out at representative WSRs and observation points in Deep Bay WCZ during the sand blanket laying and DCM works. Site audit should also be conducted throughout the marine and land-based construction under this Project to ensure that the recommended mitigation measures are properly implemented.
Discharge license(s) should be obtained under the WPCO if there are any construction site discharges. Monitoring of the construction site effluent shall be carried out in accordance with requirements stipulated in the WPCO discharge licenses.
Details of the environmental monitoring procedures and audit requirements are provided in the standalone EM&A manual.
5.11.2 Operational Phase
Marine water monitoring during the first year of Project operation is recommended to verify the impact predictions. The monitoring locations should include representative WSRs and observation points in Deep Bay WCZ. Details of the monitoring locations, frequency, procedures and audit requirements are provided in the EM&A Manual.
Discharge licenses should be obtained under the WPCO for the brine discharge from the proposed desalination plant and the spent effluent discharge from the proposed seawater cooling system. Regular monitoring of effluent quality may be specified in as a condition of the WPCO discharge license, and any necessary effluent monitoring programme should be implemented in accordance with the WPCO license requirements.
5.12.1 Construction Phase
5.12.1.1 Land-based Impact
The key sources of water quality impact arising during the land-based construction of the Project include the construction site runoff and drainage, wastewater generated from general construction activities, accidental spillage, general refuse and sewage from the workforce. The impacts could be mitigated and controlled by implementing the recommended mitigation measures. No adverse water quality impact is expected. Regular site inspections should be undertaken to inspect the construction activities and works area to ensure the recommended mitigation measures are proper implemented.
5.12.1.2 Marine-based Impact
Marine-based water quality impact would arise from the seawall modification / construction of new berthing facility for I∙PARK2. Non-dredged DCM treatment method is proposed for construction of the foundation for the proposed seawall modification / berthing facility. The DCM method enables in-situ stabilisation of the underlaying sediments without excavation, dredging, shoring or dewatering, and thus there is less exposure of wastes to the water environment. By placing the sand blanket layer on top of the DCM works areas before the DCM treatment, release of fines and cement slurry from the DCM operation is expected to be negligible.
The water quality impacts due to the sand blanket laying work have been quantitatively assessed by mathematical modelling. Suspended solid (SS) is identified as the parameter of concern. It is predicted that the SS elevations and sedimentation caused by the small-scale sand blanket laying works would be insignificant. Full water quality compliances are predicted at all representative WSRs under the unmitigated scenario. A water quality monitoring and audit programme will be implemented for the marine construction work.
5.12.2 Operational Phase
All
process waters, domestic sewage and first flush of the surface runoff generated
under the Project would be diverted to the on-site wastewater treatment systems
for proper treatment and then reused within I∙PARK2 or discharged into
the existing Urmston Road Submarine Outfall in North Western Water Control Zone
(NW WCZ). The potential water quality changes in NW WCZ due to the treated
effluent discharge has been evaluated to be insignificant. Change of coastline
configuration due to the proposed seawall modification / berthing facility as
well as the brine and spent seawater cooling effluent discharges from the
Project operation could affect the local hydrodynamics and water quality
conditions. The potential change in hydrodynamics and water quality due to the
I∙PARK2
operation was assessed by means of mathematical modelling. The hydrodynamics
regimes in the assessment area are predicted to be similar before and after the
implementation of I∙PARK2. The mixing zones of the proposed effluent
discharges are predicted to be localized and would not encroach on any WSRs.
Full water quality compliances for all concerned parameters are predicted. The
Project operation would not cause any adverse hydrodynamics and water quality
impact.