3.
Water Quality Impact
3.1 This section presents an assessment of the potential water quality impacts associated with the construction phase of the Project. Recommendations for mitigation measures have been provided, where necessary, to minimize the identified water quality impacts to an acceptable level.
3.2
In order to evaluate the potential water quality
impacts from the Project, water sensitive receivers (WSR) in
Ÿ Seawater intakes; and
Ÿ Important coral communities
Seawater Intakes
3.3
Seawater intakes identified in
3.4 It should be noted that a number of cooling water pumping stations and intakes are located within the proposed permanent reclamation limit of Wan Chai Development Phase II (WDII) along the existing waterfront of Wan Chai. These intakes supply cooling water to the air conditioning systems of various commercial buildings in the Wan Chai area including:
Ÿ
Ÿ Shui On Centre
Ÿ Telecom House
Ÿ
Ÿ Government Buildings (Wan Chai Tower/Revenue Tower/Immigration Tower)
Ÿ
Ÿ
Ÿ Great Eagle Centre
Ÿ Sun Hung Kai Centre
3.5 Cooling water intake for Sun Hung Kai Centre will be reprovisioned to the new waterfront of Wan Chai during operational phase of the proposed WDII. The rest of the above listed cooling water intakes (except for the intake of HKCEC Extension) will be reprovisioned to the intake chambers to the north of HKCEC Extension. No relocation of the existing intake of HKCEC Extension is required under the WDII project.
3.6
An existing WSD flushing water intake is also
located within the proposed WDII reclamation limit at Wan Chai
which will be upgraded and reprovisioned to
3.7 Locations of the existing and reprovisioned seawater intakes along the waterfront of Wan Chai are shown in Figure No. NEX2213/C/331/ENS/M59/502.
3.8 Two seawater intakes are located within the CBTS, which supply cooling water to the air conditioning systems of Excelsior Hotel, World Trade Centre, no. 27- 63 Paterson Street as well as Windsor House as shown in Figure No. NEX2213/C/331/ENS/M59/502. No permanent reclamation is required in CBTS under either the WDII project or this Project, and thus no permanent intake relocation would be required at CBTS. However, the cooling water intake for Windsor House would be located within the temporary reclamation works area in CBTS and therefore would need to be temporarily relocated to the adjacent area to allow continuous operation of the intake during the construction phase. Further discussion on the temporary intake relocation within CBTS is provided in Section 3.456. Location of the existing and temporarily diverted intake within the CBTS is indicatively shown in Plate 1 under Section 3.41.
Important Coral Communities
3.9
Water quality impacts on important coral
communities with conservation interest are addressed in this water quality
impact assessment. Recognized
important coral sites that are closest to the Project works are located in the
far field at
Environmental Legislation, Policies, Plans, Standards and Criteria
3.10 The criteria for evaluating water quality impacts in this EIA Study include:
Environmental Impact Assessment Ordinance (EIAO)
3.11 The Technical Memorandum on Environmental Impact Assessment Process (Environmental Impact Assessment Ordinance) (EIAO-TM) was issued by EPD under Section 16 of the EIAO. It specifies the assessment method and criteria that were followed in this Study. Reference sections in the EIAO-TM provide the details of assessment criteria and guidelines that are relevant to the water quality assessment, including:
Ÿ Annex 6 – Criteria for Evaluating Water Pollution
Ÿ Annex 14 – Guidelines for Assessment of Water Pollution
Water Quality Objectives
3.12
The Water Pollution Control Ordinance (WPCO)
provides the major statutory framework for the protection and control of water
quality in
Table 3.1
Summary of Water Quality Objectives for
|
Parameters |
Objectives |
Sub-Zone |
|
Offensive odour, tints |
Not to be present |
Whole zone |
|
Visible foam, oil scum, litter |
Not to be present |
Whole zone |
|
Dissolved oxygen (DO) within 2 m of the seabed |
Not less than 2.0 mg/l for 90% of samples |
Marine waters |
|
Depth-averaged DO |
Not less than 4.0 mg/l for 90% of samples |
Marine waters |
|
pH |
To be in the range of 6.5 - 8.5, change due to human activity not to exceed 0.2 |
Marine waters |
|
Salinity |
Change due to human activity not to exceed 10% of ambient |
Whole zone |
|
Temperature |
Change due to human activity not to exceed 2℃ |
Whole zone |
|
Suspended solids (SS) |
Not to raise the ambient level by 30% caused by human activity |
Marine waters |
|
Unionised ammonia (UIA) |
Annual mean not to exceed 0.021 mg/l as unionised form |
Whole zone |
|
Nutrients |
Shall not cause excessive algal growth |
Marine waters |
|
Total inorganic nitrogen (TIN) |
Annual mean depth-averaged inorganic nitrogen not to exceed 0.4 mg/l |
Marine waters |
|
Toxic substances |
Should not attain such levels as to produce significant toxic, carcinogenic, mutagenic or teratogenic effects in humans, fish or any other aquatic organisms. |
Whole zone |
|
Human activity should not cause a risk to any beneficial use of the aquatic environment. |
Whole zone |
Source: Statement
of Water Quality Objectives (
Water Supplies Department (WSD) Water Quality Criteria
3.13 Besides the WQO set under the WPCO, the WSD has specified a set of objectives for water quality at flushing water intakes as listed in Table 3.2 which shall not be exceeded at all stages of the Project. The target limit for suspended solids (SS) at these intakes is 10 mg/l or less.
Table 3.2 WSD’s Water Quality Criteria for Flushing Water at Sea Water Intakes
|
Parameter (in mg/l unless otherwise stated) |
Target Limit |
|
Colour (HU) |
< 20 |
|
Turbidity (NTU) |
< 10 |
|
Threshold Odour Number (odour unit) |
< 100 |
|
Ammoniacal Nitrogen |
< 1 |
|
Suspended Solids |
< 10 |
|
Dissolved Oxygen |
> 2 |
|
Biochemical Oxygen Demand |
< 10 |
|
Synthetic Detergents |
< 5 |
|
E. coli (no. per 100 mL) |
< 20,000 |
Cooling Water Intake Standards
3.14 Based on a questionnaire survey conducted under the approved Comprehensive Feasibility Study for Wan Chai Development Phase II (WDIICFS) EIA ([1]), a SS limit of 40 mg/L was adopted as the assessment criterion for MTR cooling water intakes. No information on the SS limit is available for other cooling water intakes. These findings have been confirmed by a telephone survey conducted under the recent approved EIA for the Hong Kong Convention and Exhibition Centre (HKCEC) Atrium Link Extension (ALE). The SS criterion for cooling water intakes is different from that for the WSD’s intakes as their beneficial uses are different (the former is used for cooling water system and the latter for flushing purpose).
Technical Memorandum
3.15 Discharges of effluents are subject to control under the WPCO. The Technical Memorandum on Standards for Effluents Discharged into Drainage and Sewerage Systems, Inland and Coastal Waters (TM-DSS) gives guidance on the permissible effluent discharges based on the type of receiving waters (foul sewers, storm water drains, inland and coastal waters). The limits control the physical, chemical and microbial quality of effluents. Any sewage from the proposed construction activities must comply with the standards for effluents discharged into the foul sewers, inshore waters or marine waters of Victoria Harbour WCZ, as given in the TM-DSS.
Practice Note
3.16 A Practice Note for Professional Persons (ProPECC) was issued by the EPD to provide guidelines for handling and disposal of construction site discharges. The ProPECC PN 1/94 “Construction Site Drainage” provides good practice guidelines for dealing with ten types of discharge from a construction site. These include surface runoff, groundwater, boring and drilling water, bentonite slurry, water for testing and sterilisation of water retaining structures and water pipes, wastewater from building constructions, acid cleaning, etching and pickling wastewater, and wastewater from site facilities. Practices given in the ProPECC PN 1/94 should be followed as far as possible during construction to minimise the water quality impact due to construction site drainage.
Assessment Criteria for Corals
3.17
This
water quality impact assessment has covered the impacts upon the sensitive
coral communities with conservation interest identified in the farther field including those at
3.18 Potential impacts on corals may arise through excessive sediment deposition. The magnitude of impacts on corals is assessed based on the predicted sedimentation rate and SS elevation.
3.19
According
to Pastorok and Bilyard ([2]) and Hawker and
Connell ([3]),
a sedimentation rate higher than
3.20
Besides
the sedimentation rate criterion, the WQO for SS established under the WPCO
(i.e. the SS elevations should be less than 30% of ambient baseline conditions)
is also used to evaluate the water quality impact on corals. The WQO for SS has also been adopted under the approved Tai Po Sewage
Treatment Works Stage 5 EIA as one of the assessment criteria for evaluating
the water quality impact from the sewage effluent on corals identified at
Metals and Micro-pollutants
3.21
Elutriate
tests were conducted to estimate the amount of pollutants that would be released into the water
during dredging. However, there are no relevant standards in
Table 3.3
Proposed Assessment Criteria for Dissolved Metals and Micro-Pollutants
with Reference to Standards Adopted by Other Countries
|
Parameters |
Assessment Criteria (µg/L) |
|
Arsenic |
25 1 |
|
Cadmium |
2.5 1 |
|
Chromium |
15 1 |
|
Copper |
5 1 |
|
Lead |
25 1 |
|
Mercury |
0.3 1 |
|
Nickel |
30 1 |
|
Silver |
2.3 1 |
|
Zinc |
40 1 |
|
PCBs |
0.03 2 |
|
PAHs |
3 3 |
|
TBT |
0.1 4 |
Notes:
1.
European
2. The Criterion Continuous Concentration (CCC) of National Recommended Water Quality Criteria for Saltwater of the USEPA (2006).
3. Australian water quality guidelines for fresh and marine waters.
4.
Michael H. Salazar and Sandra M. Salazar (1996).
“Mussels as Bioindicators:
Effects of TBT on Survival, Bioaccumulation, and Growth under Natural
Conditions” in Organotin, edited by M. A. Champ
and P. F. Seligman. Chapman & Hall,
Description of the Environment and Baseline Conditions
Marine Water Quality in
3.22
Marine water quality monitoring data routinely
collected by EPD were used to establish the baseline condition. The EPD monitoring data collected in
2008 are summarized in Table 3.4 for Central Victoria Harbour
WCZ (Stations VM4 and VM5).
Descriptions of the baseline water quality conditions provided in the
subsequent sections are extracted from the EPD’s report “2008 Marine Water Quality in
3.23
In the past, wastewater from both sides of the
Table 3.4
Baseline Marine Water Quality Condition for
|
Parameters |
|
WPCO WQO (in marine waters) |
||
|
VM4 |
VM5 |
|||
|
Temperature (℃) |
23.4 (16.2 – 27.1) |
23.5 (16.3 – 27.2) |
Not more than 2℃ in daily temperature range |
|
|
Salinity |
31.3 (26.2 – 33.2) |
30.9 (25.7 – 32.7) |
Not to cause more than 10% change |
|
|
Dissolved Oxygen (DO) (mg/L) |
Depth Average |
5.3 |
5.0 (3.0 – 6.2) |
Not less than 4 mg/L for 90% of the samples |
|
Bottom |
4.9 |
5.0 (3.0 – 6.8) |
Not less than 2 mg/L for 90% of the samples |
|
|
Dissolved Oxygen (DO) (% Saturation) |
Depth Average |
73 |
70 (45 – 89) |
Not Available |
|
Bottom |
69 |
69 (45 – 85) |
Not Available |
|
|
pH |
8.0 |
8.0 (7.9 – 8.3) |
6.5 - 8.5 (± 0.2 from natural range) |
|
|
Secchi disc Depth (m) |
2.5 |
2.3 (1.8 – 3.3) |
Not Available |
|
|
Turbidity (NTU) |
7.9 |
7.9 (3.1 – 12.0) |
Not Available |
|
|
Suspended Solids (SS) (mg/L) |
5.1 |
5.0 (2.8 – 8.7) |
Not more than 30% increase |
|
|
5-day Biochemical Oxygen Demand (BOD5) (mg/L) |
0.8 |
1.2 (0.3 – 3.5) |
Not Available |
|
|
Ammonia Nitrogen (NH3-N) (mg/L) |
0.13 |
0.17 (0.05 – 0.27) |
Not Available |
|
|
Unionised Ammonia (UIA) (mg/L) |
0.006 |
0.007 (0.001 – 0.010) |
Not more than 0.021 mg/L for annual mean |
|
|
Nitrite Nitrogen (NO2-N) (mg/L) |
0.035 |
0.039 (0.020 – 0.146) |
Not Available |
|
|
Nitrate Nitrogen (NO3-N) (mg/L) |
0.156 |
0.176 (0.098 – 0.447) |
Not Available |
|
|
Total Inorganic Nitrogen (TIN) (mg/L) |
0.32 |
0.39 (0.22 – 0.71) |
Not more than 0.4 mg/L for annual mean |
|
|
Total
Kjeldahl Nitrogen (mg/L) |
0.33 |
0.40 (0.23 – 0.59) |
Not Available |
|
|
Total Nitrogen (TN) (mg/L) |
0.52 |
0.62 (0.40 – 0.93) |
Not Available |
|
|
Orthophosphate Phosphorus (OrthoP) (mg/L) |
0.028 |
0.032 (0.009 – 0.057) |
Not Available |
|
|
Total Phosphorus (TP) (mg/L) |
0.04 |
0.05 (0.04 – 0.09) |
Not Available |
|
|
Silica (as SiO2) (mg/L) |
1.0 |
1.1 (0.1 – 2.7) |
Not Available |
|
|
Chlorophyll-a (µg/L) |
3.5 |
3.9 (0.3 – 19.3) |
Not Available |
|
|
E.coli (cfu/100mL) |
2,900 |
4,200 (840 – 23,000) |
Not Available |
|
|
Faecal Coliforms (cfu/100mL) |
6,300 |
10,000 (1,400 – 81,000) |
Not Available |
|
Notes:
1.
Data source: Marine Water Quality in
2. Except as specified, data presented are depth-averaged values calculated by taking the means of three depths: Surface, mid-depth and bottom.
3. Data presented are annual arithmetic means of depth-averaged results except for E.coli and faecal coliforms that are annual geometric means.
4. Data in brackets indicate the ranges.
Marine Water Quality within
3.24
A summary of published EPD monitoring data (in
2008) collected from the monitoring station at the Causeway Bay Typhoon Shelter
(VT2) is presented in Table 3.5. The data
are extracted from the EPD’s publication “2008
Marine Water Quality in
Table 3.5
Baseline Marine Water Quality Condition for
|
Parameters |
EPD Monitoring Station (Bi-Monthly) |
WPCO WQO (in marine waters) |
|
|
VT2 |
|||
|
Temperature (℃) |
23.2 (15.6 – 26.8) |
Not more than 2℃ in daily temperature range |
|
|
Salinity (ppt) |
30.0 (28.3 – 31.8) |
Not to cause more than 10% change |
|
|
Dissolved Oxygen (DO) (% Saturation) |
Depth Average |
60 |
Not Available |
|
Bottom |
60 |
Not Available |
|
|
Dissolved Oxygen (DO) (mg/L) |
Depth Average |
4.3 |
Not less than 4 mg/L for 90% of the samples |
|
Bottom |
4.4 |
Not less than 2 mg/L for 90% of the samples |
|
|
pH |
7.9 |
6.5 - 8.5 (± 0.2 from natural range) |
|
|
Secchi disc Depth (m) |
2.1 |
Not Available |
|
|
Turbidity (NTU) |
8.5 |
Not Available |
|
|
Suspended Solids (SS) (mg/L) |
5.6 |
Not more than 30% increase |
|
|
Silica (as SiO2) (mg/L) |
1.4 |
Not Available |
|
|
5-day Biochemical Oxygen Demand (BOD5) (mg/L) |
1.4 |
Not Available |
|
|
Nitrite Nitrogen (NO2-N) (mg/L) |
0.033 |
Not Available |
|
|
Nitrate Nitrogen (NO3-N) (mg/L) |
0.199 |
Not Available |
|
|
Ammonia Nitrogen (NH3-N) (mg/L) |
0.24 |
Not Available |
|
|
Unionised Ammonia (UIA) (mg/L) |
0.009 |
Not more than 0.021 mg/L for annual mean |
|
|
Total Inorganic Nitrogen (TIN) (mg/L) |
0.47 |
Not more than 0.4 mg/L for annual mean |
|
|
Total Nitrogen (TN) (mg/L) |
0.74 |
Not Available |
|
|
Orthophosphate Phosphorus (OrthoP) (mg/L) |
0.042 |
Not Available |
|
|
Total Phosphorus (TP) (mg/L) |
0.07 |
Not Available |
|
|
Chlorophyll-a (µg/L) |
2.0 |
Not Available |
|
|
E.coli (cfu/100mL) |
3,500 |
Not Available |
|
|
Faecal Coliforms (cfu/100mL) |
8,800 |
Not Available |
|
Notes:
1. Except as specified, data presented are depth-averaged data.
2. Data presented are annual arithmetic means except for E.coli and faecal coliforms that are geometric means.
3. Data enclosed in brackets indicate ranges.
3.25 Due to the embayment form and reduced flushing capacity of the typhoon shelter, marine water within the typhoon shelter is vulnerable to pollution. In 2008, high levels of E.coli were recorded at the Causeway Bay Typhoon Shelter indicating faecal contamination. The water quality level marginally exceeded the WQO for TIN but fully complied with the WQO for DO and UIA. Significant long-term improvements in terms of decreasing trends in TIN, TN, OrthoP and TP were observed in Causeway Bay Typhoon Shelter (CBTS).
Sediment Quality
3.26 The results of marine sediment quality analysis from the marine ground investigation works at the Project site are presented in Section 6 (under the Waste Management Section). A review of the sediment quality data from the marine ground investigation indicated that most of the marine sediments to be dredged under the Project were classified as contaminated (Category M or H). Details of the sediment quality criteria and guidelines as well as a comprehensive review of the sediment quality data collected at the proposed marine works areas are given in Section 6.
Identification of Potential Impacts
General Description of Construction Works
3.27 The Shatin to Central Link (SCL) Protection Works would be constructed by cut and cover method involving temporary reclamation within the CBTS. Marine dredging and filling works would be required for construction of the temporary reclamation.
3.28 Dredging of marine mud would be required at the southeast corner of the CBTS to provide space for temporary relocation of anchorage area due to temporary reclamation for the Protection Works.
3.29 The temporary reclamation for the Protection Works would also require relocation of the temporary RHKYC jetty to a new location within the CBTS, which would involve minor piling works. No dredging is required for construction of the temporary jetty.
3.30 Consideration of alternative construction options and development of the preferred option are discussed in detail under Section 2.
Identification of Construction Phase Impacts
Marine Construction Works
3.31 The key water quality impacts would be associated with the proposed dredging and filling works within the CBTS as identified below:
Ÿ Dredging works will disturb the marine bottom sediment, causing an increase in SS concentrations in the water column and forming sediment plume along the tidal flows.
Ÿ Loss of fill materials into the water column during filling activities causing an increased SS level.
Ÿ Release of sediment-bound contaminants such as heavy metals and nutrients into the water column, either via suspension or by disturbance as a result of dredging.
Ÿ Release of the same contaminants due to leakage and spillage as a result of poor handling and overflow from barges during dredging and transport.
3.32 Temporary embayments will be formed between the partially reclaimed land as the temporary reclamation proceeds in stages. Potential accumulation of pollutants from contaminated stormwater runoff (due to debris and oil / grease left on the ground, and organic matter from expedient connections) into the temporary embayments may increase the dissolved oxygen demand in the slack water, causing dissolved oxygen depletion and, in turn, potential odour impacts on the neighbouring sensitive receivers.
3.33 Minor piling works would be required for construction of the temporary jetty within the CBTS. Release of sediment and wastewater generated from the pilling works would potentially increase the SS concentrations in the water column, if not well controlled. Assessment of the potential water quality impact from the pilling activities is given in Section 3.62.
Land-based Construction
General Construction Activities and Sewage from
Construction Workforce
3.34 The land-based construction works could have the potential to cause water pollution. Various types of construction activities may generate wastewater. These include general cleaning and polishing, dust suppression and utility installation. These types of wastewater would contain high concentrations of SS. Impacts could also result from the sewage effluent from the construction work force involved with the construction. If uncontrolled, these effluents could lead to deterioration in water quality.
Construction Site Run-off
3.35 Construction site run-off would cause potential water quality impacts. During rainstorms, site run-off would wash away the soil particles on unpaved lands and areas with the topsoil exposed. The run-off is generally characterized by high concentrations of SS. Release of uncontrolled site run-off would increase the SS levels and turbidity in the nearby water environment. Potential pollution sources of site run-off may include:
Ÿ Run-off and erosion of exposed bare soil and earth, drainage channel, earth working area and stockpiles.
Ÿ Wastewater from any dewatering activities as a result of excavation of wet material during tunnel construction.
Ÿ Release of any bentonite slurries, concrete washings and other grouting materials with construction run-off, storm water or waste water from dewatering process.
Ÿ Wash water from dust suppression sprays.
Ÿ Fuel, oil and lubricants from maintenance of construction vehicles and equipment.
3.36 Wind blown dust would be generated from exposed soil surfaces in the works areas. It is possible that wind blown dust would fall directly onto the nearby water bodies when a strong wind occurs. Dispersion of dust within the works areas may increase the SS levels in surface run-off causing a potential impact to the nearby sensitive receivers.
Accidental Spillage
3.37 A large variety of chemicals may be used during construction activities. These chemicals may include petroleum products, surplus adhesives, spent lubrication oil, grease and mineral oil, spent acid and alkaline solutions/solvent and other chemicals. Accidental spillage of chemicals in the works areas may contaminate the surface soils. The contaminated soil particles may be washed away by construction site run-off or storm run-off causing water pollution.
Marine Construction
3.38 Construction of the SCL Protection Works would involve dredging and temporary reclamation within the CBTS. Temporary reclamation within the CBTS for SCL Protection Works is tentatively scheduled to commence in 2012 for completion in 2014. Dredging of marine mud at the southeast corner of CBTS for relocation of mooring space is tentatively scheduled to be undertaken in 2012.
Temporary Reclamation within CBTS
Construction Method
3.39 Construction of the SCL Protection Works within the CBTS will have works interfaces with the construction of the Central-Wan Chai Bypass (CWB) tunnel. The proposed temporary reclamation method would adopt an approach where dredging and temporary seawall construction will be first conducted to enclose each phase of the temporary reclamation. Installation of diaphragm wall on temporary reclamation as well as any bulk filling will proceed behind the completed seawall. Any gaps that may need to be provided for marine access will be shielded by silt curtains to control sediment plume dispersion away from the site. Demolition of temporary reclamation including the demolition of the diaphragm wall and dredging to the existing seabed levels will also be carried out behind the temporary seawall. Temporary seawall will be removed after completion of all excavation and dredging works for demolition of the temporary reclamation. Therefore, the sediment plume can be effectively contained within the temporary reclamation area. Demolition of temporary seawall will involve removal of rock fill and seawall blocks only, which would not create significant SS impact. Fines content in the filling materials for seawall construction would be negligible and loss of fill material during seawall construction is therefore not expected. Thus, potential water quality impact of SS will only arise during the dredging work before completion of the temporary seawall.
3.40 It should be noted that temporary mooring areas would be proposed inside the existing CBTS and Public Cargo Working Area (PCWA) under the current construction scheme. Therefore, the temporary breakwater originally proposed under the approved WDII & CWB EIA for temporary moorings outside the CBTS breakwater would not be necessary under the currently adopted scheme. Dredging of marine mud would be required at the southeast corner of the CBTS to provide space for temporary relocation of anchorage area due to temporary reclamation for the Protection Works.
Phasing and Sequence
3.41 The construction for SCL Protection Works and CWB within the CBTS would be undertaken in 10 phases, namely TS1, TS4, TS4 Ext., PW1.1, PW 1.2, PW 1.3 and PW 1.4, TS2, TS3(W) and TS3(E) respectively, as indicatively shown in Plate 1 below. Temporary reclamation would also be required within and immediately outside the CBTS under the project “Shatin Central Link – Hung Hom to Admiralty Section (SCL (HUH-ADM))”, namely SCL2, SCL 3.1 and SCL 3.2 as indicated in Plate 1 below. Construction of SCL2, SCL3.1 and SCL3.2 would however be undertaken after completion of the SCL Protection Works and hence would not have any interfacing issues with this Project. The tentative programme of the temporary reclamations within the CBTS is given in Appendix 2.3. Staging of the temporary reclamation works is shown indicatively in Appendix 3.2. It should be noted that Plate 1 below aims only to show the indicative locations of the temporary reclamations for the SCL. The actual temporary reclamation extent for the SCL Protection Works is illustrated in Figure Nos. NEX2213/C/331/ENS/M50/501 and NEX2213/C/331/ENS/M50/502.

![]()
![]()
![]()
![]()
![]()
![]()
![]()
![]()
![]()
![]()
![]()
![]()
|
Plate 1. Temporary Reclamation Scheme
3.42
Dredging for TS1 and TS4 will be undertaken
tentatively in 2010. Dredging for TS4 Ext., PW1.1, PW1.3 and PW1.4 as well as
dredging for relocation of mooring space will commence tentatively in 2012 and
will be undertaken after the dredging works for TS1 and TS4 are completed. Construction
of PW1.2 will be undertaken within the seawall of TS4 and hence no seawall
construction would be required under PW1.2.
3.43 Dredging and construction of temporary seawall for TS2 will also commence tentatively in 2012, potentially concurrent with the construction works for TS4 Ext. and PW1.1, PW1.3 and PW1.4. Demolition of TS1 will proceed before commencement of TS2, TS4 Ext., PW1.1, PW1.3 and PW1.4. The whole TS1 will be removed before commencement of TS2, TS4 Ext., PW1.1 to 1.4. Hence, dredging at TS2, TS4 Ext., PW1.1, PW1.3 and PW1.4 would potentially take place when the seawall of TS4 is in place. On the other hand, dredging at southeast corner for relocation of mooring space is tentatively scheduled for carrying out in early 2012 before commencement of TS2, TS4 Ext., PW1.1, PW1.3 and PW1.4 and would be potentially undertaken when the seawalls of both TS1 and TS4 are in place (with no other concurrent dredging work inside the CBTS). In case dredging at the southeast corner of CBTS for relocation of mooring space and dredging for TS2, TS4 Ext., PW1.1, PW1.3 and PW1.4 are required to work concurrently within the CBTS during the actual implementation of the Project, the potential cumulative water quality impact would be controlled by limiting the total combined dredging rate within the CBTS as discussed in detail under Sections 3.49, 3.53 and 3.59.
3.44 Dredging for TS3(E) is tentatively scheduled for commencement in the first quarter of 2014 when only PW1.4 is in place. TS4, TS2, TS4 Ext. and PW1.1 to 1.3 will be completely removed before commencement of TS3(E). Dredging and seawall construction for TS3(W) will be undertaken tentatively in the second quarter of 2014. Therefore, water body behind temporary reclamation area will not be fully enclosed, which minimize water quality impacts. Part of the reclamation for the SCL Protection works (namely PW1.4) would be retained within the CBTS under this Project. Hence, dredging for TS3(W) would be carried out when TS3(E) and PW1.4 are in place.
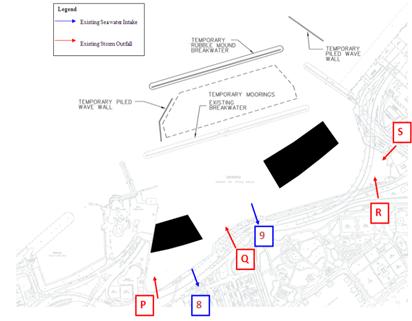
3.46 There are two existing cooling water intakes (namely Intakes 8 and 9 respectively as shown in Figure No. NEX2213/C/331/ENS/M59/502) and four existing storm outfalls (namely Culverts P, Q, R and S respectively as shown in Figure No. NEX2213/C/331/ENS/M59/504) located in the CBTS. As shown in Plate 1 above, the storm outfall (Culvert Q) and the cooling water intake for Windsor House (Intake 9) are located in the area of TS3(W). Before the seawall construction at TS3(W) is completed, the cooling water intake will be diverted to the adjacent area and the intake point would be slightly shifted to the east along the existing seawall outside the TS3(W) site to ensure continuous operation of the intake during the construction period (similar to the arrangement adopted under the approved WDII & CWB EIA). Furthermore, the storm outfall (Culvert Q) will be temporarily diverted to the north of TS3(W) before the seawall of TS3(W) is completely constructed. No temporary diversion will be implemented for Intake 8 as well as Culverts P, R and S.
Impacts from Sediment Plume upon the Water Quality inside the CBTS
3.47 There is no biological sensitive receiver within the CBTS and there are no areas of conservation value, ecological importance or mariculture activities in the vicinity. The closest water sensitive receivers to the temporary reclamation works would be the cooling water intakes for Excelsior Hotel and World Trade Centre (namely Intake 8) and Windsor House (namely Intake 9) as shown in Plate 1 and Figure No. NEX2213/C/331/ENS/M59/502. No SS criterion was available for these cooling water intakes (refer Section 3.14).
3.48 The dredging work along the southern seawall of TS4, PW1.1 and PW1.4 would be closest to Intake 8. The dredging work along the seawall of TS3(W) and TS3(E) (which are non SCL activities) as well as the dredging for relocation of mooring space would be closest to Intake 9. Hence, these dredging activities would be most critical in terms of the water quality impact upon the cooling water intakes. The remaining dredging works would be further away from the cooling water intakes and the associated water quality impacts are considered less significant. Following the recommendations provided in the approved WDII & CWB EIA, the following water quality mitigation measures are recommended for marine construction inside the CBTS due to their close proximity to the cooling water intakes:
Ÿ Temporary seawall should be partially constructed to protect the nearby seawater intakes from further dredging activities. For example, the seawalls along the southeast and northeast boundaries of PW1.1 and PW1.4 should be constructed first (above high water mark) so that the seawater intake at the inner water would be protected from the impacts from the remaining dredging activities along the northwest boundary;
Ÿ Dredging should be carried out by closed grab dredger to minimize release of sediment and other contaminants during dredging;
Ÿ Silt curtains should be deployed to fully enclose the closed grab dredger during any dredging operation, i.e. all dredging works proposed inside the CBTS (including those within the boundary of PW1.1 to PW1.4, SCL2, SCL 3.1, SCL 3.2, TS1, TS4, TS4 Ext., TS2, TS3(W) and TS3(E) for temporary reclamation and at southeast corner of the CBTS for relocation of mooring space) as indicated in Plate 1 would be carried out with the deployment of silt curtain;
Ÿ Silt screens should be installed at the cooling water intakes within the CBTS during the temporary reclamation period;
Ÿ Site audit and water quality monitoring should be carried out at the seawater intakes during the marine works.
3.49 In addition, no more than two dredgers (of about 8 m3 capacity each) would be operated for dredging within the typhoon shelter at any time. The total dredging rate of no more than 6,000 m3 per day will be maintained within the CBTS throughout the construction period. Works for this Project (including PW1.1 to 1.4 for construction of the Protection Works as well as dredging at the southeast corner of the CBTS for relocation of mooring space), which will have interfacing issues with the CWB construction, will be carried out by the same contractor of the CWB project. Hence, TS1, TS2, TS4, TS4 Ext, PW1.1 to 1.4 and dredging for relocation of mooring space will be carried out under the same contract to ensure that the maximum dredging rate within the CBTS would not exceed the required limit of 6,000 m3 per day.
3.50 A modelling scenario is proposed under this EIA to assess the water quality impact during the seawall dredging along PW1.1 within the CBTS. This scenario assumes that dredging along the southern seawall of PW1.1 would take place after the formation of TS4 and TS1, and hence, a temporary embayment would be formed at the southwest corner of the CBTS where Intake 8 is located. Based on the tentative programme, TS1 would already be removed when dredging at PW1.1 is carrying out. TS1 is however assumed to be in place under this modeling scenario, which is a conservative assumption in terms of the flushing impact at CBTS. Under this scenario, dredging will be carried out within this temporary embayment at the maximum dredging rate of 6,000m3 per day, which would be the worst case in terms of the tidal circulation at the southwest corner of the CBTS and potential impact upon Intake 8. Impact from dredging along the seawall of TS4 would be less critical as the dredging work would be conducted before formation of any temporary seawall within the CBTS which would result in a better tidal flushing. Water quality impact from seawall dredging at TS4 (before formation of any temporary reclamation within the CBTS) had been fully assessed under the approved WDII & CWB EIA to be acceptable. Impact from dredging at TS4 Ext. would also be less critical and the dredging work would be undertaken in a more open area with better flushing and dispersion capacity. The dredging scenario assumed under this EIA for water quality modelling is presented in Table 3.7 below as well as graphically shown in Figure No. NEX2213/C/331/ENS/M59/505.
3.51 Impact during the seawall dredging work for the remaining dredging phases (i.e. PW1.3) would be less critical as the dredging locations would be further away from the cooling water intakes. Thus the proposed assessment scenario would represent the worst case scenario for the dredging works within the CBTS.
3.52 The dredging work under the assessment scenario is assumed to be undertaken at a maximum rate of 6000 m3 per day using two closed grab dredgers. It is assumed that both dredgers would be operated at a location closest to Intake 8 for worst case assessment. All dredging works proposed inside the CBTS (including those within the boundary of PW1.1 to PW1.4, SCL2, SCL 3.1, SCL 3.2, TS1, TS4, TS4 Ext., TS2, TS3(W) and TS3(E) for temporary reclamation and at southeast corner of the CBTS for relocation of mooring space) as indicated in Plate 1 would be carried out with the deployment of silt curtain. Silt screens would be installed at the cooling water intakes within the CBTS to minimize the potential impact.
3.53
Dredging of marine mud at the southeast corner
of CBTS for relocation of mooring space is tentatively scheduled to be
undertaken in 2012. The total dredging rate within the CBTS shall not exceed
6,000m3 per day at any time. As mentioned in Section 3.50, dredging is assumed under the assessment scenario to
be undertaken at PW1.1 at the maximum dredging rate of 6,000m3
per day inside the temporary embayment close to Intake 8,
which would represent a worst case in terms of the potential impact upon the
seawater intakes due to the SCL Protection Works. As the distance between the
dredging area for relocation of mooring space and the nearest seawater intake
point would be greater than the distance between PW1.1 and the nearest intake
point assumed under the assessment scenario (see Plate 1 under Section 3.41), dredging for relocation of mooring space would not
be worse than dredging at PW1.1 in terms of the potential impact upon the
intake points. It should be noted that the nearest distance of Intake 8 from
PW1.1 as shown in Plate 1 above has
already taken account of the maximum temporary reclamation extent proposed for
the SCL Protection Works. In case dredging at the southeast
corner of CBTS for relocation of mooring space and dredging for
SCL Protection Works and CWB tunnel construction are required to work concurrently within the CBTS, the combined
production rate for these dredging works would still be maintained at or below 6,000m3
per day.
3.54 As the CBTS is a nearly enclosed marine embayment, the sediment plume generated from the dredging work for temporary reclamation is expected to be mainly confined within the CBTS and would not contribute any significant cumulative impact with other concurrent activities in the open harbour as demonstrated from the model results available from the approved WDII & CWB EIA.
Water Quality in Temporary Embayments within the CBTS
3.55 Because of the relatively low flushing capacity, the interim construction phase water quality of the temporary embayments at the existing CBTS is of particular concern. However, there is no biological sensitive receiver within the CBTS and there are no areas of conservation value, ecological importance or mariculture activities in the vicinity. The only water sensitive receivers inside the CBTS would be the cooling water intakes (namely Intakes 8 and 9) with no water quality (e.g. suspended solids) requirements. Therefore, the key concern would be the accumulation of pollutants discharged from the polluted storm culverts within any temporary embayment formed from the temporary reclamations, potentially causing an increase in the DO demand and, in turn, potential DO depletion and odour impacts.
3.56 Year 2013 (i.e. when the TS2, TS4, TS4 Ext. and PW1.1 to 1.4 will be in place simultaneously) would be the worst-case scenario in terms of the water quality impact, considering that these land formations would create a temporary embayment at the southwest corner of the CBTS where a storm outfall, namely Culvert P, and a cooling water intake, namely Intake 8, are located close to each other. Potential water quality impact associated with the accumulation of pollutants discharged from the storm culverts into the temporary embayment was modelled under the approved WDII & CWB EIA for one interim construction scenario (namely Scenario 3C). This scenario assumed that TS4, TS4 Ext, TS2 and TS3(E) as well as a temporary typhoon shelter (including a temporary breakwater and piled wave wall) outside the existing CBTS (the temporary typhoon shelter has been deleted from the scope of CWB project, see remarks below) would be in place at the same time, which represented a very worse case in terms of the water circulation in CBTS as shown in the figure below.
|
|
|

3.57 As shown by EPD’s routine marine water quality monitoring data, the existing DO levels measured in the CBTS are good and potential DO depletion inside the CBTS is not a concern. The model results available from the approved EIA for Scenario 3C also indicated that the DO levels were not depleted inside the embayments formed by the temporary reclamations. The predicted minimum DO levels were all > 5 mg/L (see figure above).
3.58 As compared to Scenario 3C simulated under the approved WDII & CWB EIA, changes in the land configuration in 2012 proposed under the latest reclamation scheme would involve a relatively small amount of additional temporary land for SCL Protection Works, which could slightly reduce the flushing capacity in the CBTS, but on the other hand, the temporary breakwaters and wave walls assumed under the approved EIA would not be necessary under the current scheme (better flushing effect would be achieved in the CBTS with no temporary breakwaters and wave walls). Also, TS3(E) assumed under Scenario 3C of the approved EIA would not be in place during 2013 under the current reclamation sequence. The proposed changes in land configurations under the current reclamation scheme are considered minor in terms of their overall impact on the flushing capacity in the CBTS and would unlikely affect the conclusion of the model results available from the approved WDII & CWB EIA for the interim construction scenario. A water quality monitoring and audit programme will be implemented during the construction phase to avoid aggravation of odour nuisance from seawater arising from temporary reclamation in the CBTS. In case the temporary reclamation work for SCL Protection Works is found during the water quality monitoring and audit programme to cause unacceptable oxygen depletion (e.g. DO level <2 mg/L) in the CBTS, additional water quality improvement measures (e.g. use of aeration method to improve the DO levels in the marine embayment) will be considered and implemented in the CBTS as necessary to rectify the problems. Details of the water quality monitoring and audit programme including the Event and Action Plan are provided in the standalone EM&A Manual for this Project.
Dredging for Relocation of Mooring Space within CBTS
3.59
Dredging
would be undertaken at the eastern part of the CBTS tentatively in 2012 for
relocation of mooring space. The proposed dredging extent is shown in Plate 1 under Section 3.41. The total dredging rate within the CBTS shall
not exceed 6,000m3 per day at any time. In case
dredging at the southeast corner of CBTS for relocation of mooring space and
dredging for SCL Protection Works and CWB tunnel construction are required to
work concurrently within the CBTS, the total maximum dredging rate of 6,000m3
per day would still be maintained within the CBTS
(refer to Section 3.53). Silt
curtain would be installed around the dredging operation to minimize the
release of sediments. As previously mentioned, the closest water sensitive
receivers to the proposed works would be the cooling water intakes for
Excelsior Hotel and World Trade Centre (namely Intake 8) and Windsor House
(namely Intake 9) as shown in Plate 1
above. The sediment plume modelling scenario proposed for the assessment of the
dredging works within the CBTS (refer to Table
3.7 below) already represent the worst case in terms
of the potential water quality impact within the CBTS assuming a maximum
dredging rate of 6000m3 per day. The sediment source assumed under the
assessment scenario is located near PW1.1, which is approximately 50m away from
Intake 8 (see Plate 1 above) and
both the source point and the intake point would be located in a temporary
embayment with low flushing capacity. It should be noted that the nearest
distance of Intake 8 from PW1.1 (i.e. 50m) as shown in Plate 1 above has already taken account of the maximum temporary
reclamation extent proposed for the SCL Protection Works. On the other hand,
dredging for relocation of mooring space at the eastern part of CBTS would
result in the same total effective sediment loss rate but the sediment source
would be further away from the nearest cooling water intake (i.e. Intake 9),
see Plate 1 above. Therefore, the
water quality impacts upon Intake 9 due to the dredging work for relocation of
mooring space would not be worse than that upon Intake 8 under the assessment
scenario due to the dredging works for PW1.1. Hence, no additional modelling
scenario is proposed for dredging at the southeast corner of the CBTS for
relocation of mooring space. Similarly, the concurrent dredging for TS2
(which is not SCL activity) would be carried out at a more open marine
environment while the minimum distance from the closest WSR (Intake 9) is about
65m. Given that the maximum dredging rate within the CBTS will be maintained at
6,000 m3 per day, the assumed modelling
scenario would already represent the worst case water quality impact and
therefore no additional modelling scenario will be
required.
Consideration of Possible Water Quality Mitigation Measures
3.60 Silt curtains would be highly effective in areas where current speeds are low, as the effectiveness of the silt curtains will be reduced in areas of high current speeds.
3.61 Deployment of floating type silt curtain would be practical for dredging and sand filling operations within the embayed area of CBTS where the water currents would be relatively small. All dredging works proposed inside the CBTS (including those within the boundary of PW1.1 to PW1.4, SCL2, SCL 3.1, SCL 3.2, TS1, TS4, TS4 Ext., TS2, TS3(W) and TS3(E) for temporary reclamation and at southeast corner of the CBTS for relocation of mooring space) as indicated in Plate 1 would be carried out with the deployment of silt curtain.
Construction of the Temporary Jetty
3.62 Piling (pipe piles or driven piles) will be carried out for construction of the temporary jetty within the CBTS. No dredging would be required for the jetty construction works. The indicative layout of the temporary jetty showing the possible arrangement and extent of the marine piles is given in Appendix 3.1. Location and scale of the temporary jetty with respect to the temporary reclamation area is also indicated in Figure No. NEX2213/C/331/ENS/M59/502. As shown in Figure No. NEX2213/C/331/ENS/M59/502 and Appendix 3.1, the footprint of the temporary jetty (including the marine piles) is considered minimal as compared to that of the proposed temporary reclamation. The piling activities would be minor in scale and farther away (at least 200m) from the cooling water intakes (as compared to the reclamation activities). Loss of fines, if any, from the marine piling work is considered short term, localised and minor. The potential release of sediment or excavated materials could be controlled through the installation of silt curtains surrounding the working area as necessary. All wastewater generated from the piling activities will be collected by a derrick lighter or other collection system and be treated before controlled discharge. Spoil should be collected by sealed hopper barges for proper disposal. No unacceptable water quality impact due to the jetty construction work would be expected.
Other Possible Concurrent Projects
3.63 With reference to the EIA Study Brief, the assessment area shall include the Victoria Harbour Water Control Zone (WCZ) as declared under the Water Pollution Control Ordinance (WPCO), and any areas within a distance of 300m from the Project boundary and from any works sites. Other possible concurrent dredging and filling activities within the assessment area such as those for the construction of the proposed SCL (HUH-ADM), WDII & CWB and Kai Tak Development (KTD) as well as the Installation of Submarine Gas Pipelines from Ma Tau Kok to North Point for Former Kai Tak Airport Development (New Submarine Gas Main) have been considered in the water quality assessment.
SCL (HUH-ADM)
3.64 Based on the latest information available from the project “SCL (HUH-ADM)”, the proposed marine construction works will involve:
Ÿ Immersed
tube construction for cross harbour tunnel across
Ÿ Temporary reclamation near and within the CBTS (namely SCL3.1, SCL3.2 and SCL2, as shown in Plate 1 under Section 3.41) as well as at the Hung Hom Landfall
3.65 The marine construction works for SCL (HUH-ADM), including the immersed tube construction and temporary reclamation, is tentatively scheduled for commencement in 2015 and therefore would not be concurrent with the Protection Works at CBTS.
Wan Chai Development Phase II (WDII) and Central-Wan Chai Bypass (CWB)
3.66 Based on the latest design information available from the project “WDII – Design and Construction for Trunk Road Tunnel Option under SA2 to Agreement No. CE 54/2001” and the project “Design & Construction of CWB / IEC Link under SA3 to Agreement No. CE8/95”, the proposed marine construction works for WDII and CWB will involve:
Ÿ Permanent reclamation at Hong Kong Convention and Exhibition Centre (HKCEC)
Ÿ Permanent reclamation at Wan Chai (WCR)
Ÿ Permanent reclamation at North Point (NPR)
Ÿ Temporary reclamation at Public Cargo Working Area (TPCWA) and Causeway Bay (TCBR) for construction of the CWB tunnel
Ÿ Construction of new cross-harbour water mains from Wan Chai to Tsim Sha Tsui
Ÿ Construction of Wan Chai East submarine sewage outfall
3.67 The following measures have been implemented in the design of reclamation phasing to ensure the continuous operation of the existing waterfront facilities and, simultaneously, to minimize the impacts on water quality:
Ÿ a number of small and confined areas of land formation are planned;
Ÿ containment of fill within each of these confined areas by seawalls is proposed, with the seawall constructed first (above high water mark) with filling carried out behind the completed seawalls. Any gaps that may need to be provided for marine access will be shielded by silt curtains to control sediment plume dispersion away from the site. Filling should be carried out behind the silt curtain.
3.68 Therefore, potential water quality impact of SS would only arise during the dredging for seawall foundation. There will be a total of five main reclamation shoreline zones, namely HKCEC, WCR, NPR, TPCWA and TCBR respectively. Each of these five reclamation shoreline zones is subdivided into different stages as indicated in Table 3.6 below. Within the same reclamation zone, seawall dredging will be performed in sequence instead of operating concurrently. Thus, dredging along the seawall will be undertaken for only one stage at a time to minimize the potential water quality impacts within each reclamation zone. The TCBR for construction of the CWB tunnel inside the CBTS would be combined with the SCL Protection Works as detailed in Sections 3.39 to 3.61 above and is therefore not further described in this section. The indicative programme for seawall dredging works at different stages of the WDII and CWB construction are also provided in Table 3.6 below. The layout of different reclamation stages for HKCEC, WCR and NPR as well as the locations of the proposed water mains and sewage outfall would follow those presented in Figure 2.7 of the approved WDII & CWB EIA (http://www.epd.gov.hk/eia/register/report/eiareport/eia_1412007/html/Vol%204%20-%20Figures/FIG%202.7.pdf). Layout of the revised temporary reclamation scheme inside CBTS is indicatively presented in Plate 1 above.
3.69 Dredging will be carried out by closed grab dredger for the following works:
Ÿ Seawall construction in all the reclamation shoreline zones (HKCEC, WCR, NPR, TPCWA)
Ÿ Construction of the proposed water mains
Ÿ Construction of the proposed sewage outfall
3.70 Deployment of silt curtains around the closed grab dredgers to contain SS within the construction site during seawall dredging and seawall trench filling is recommended for the areas of HKCEC, WCR and NPR. Based on the water quality modelling and assessment result, deployment of silt curtains is considered not necessary for the dredging works at TPCWA.
3.71 The maximum dredging rates recommended for different marine works zones are given in Table 3.6. The dredging rate and mitigation measures recommended for the TCBR are detailed in Sections 3.39 to 3.61 and are therefore not repeated in this section. It should be noted that the dredging rates listed in Table 3.6 have not considered the effect of silt curtains as recommended for HKCEC, WCR and NPR.
Table 3.6 Tentative Programme and Recommended Maximum Dredging Rates for WDII and CWB
|
Reclamation Zone |
Tentative Programme |
Maximum Dredging Rate |
||
|
m3 per day |
m3 per hour |
m3 per week |
||
|
Dredging along seawall or breakwater |
||||
|
North Point Reclamation (NPR) Shoreline
Zone |
||||
|
NPR Stage 1 |
2010 |
6,000 |
375 |
42,000 |
|
NPR Stage 2 West |
2010 |
6,000 |
375 |
42,000 |
|
NPR Stage 2 East |
2011 |
6,000 |
375 |
42,000 |
|
Temporary Public Cargo Working Area (TPCWA) Reclamation
Shoreline Zone |
||||
|
TPWCA East |
2010 |
5,000 |
313 |
35,000 |
|
TPWCA West |
2013 |
5,000 |
313 |
35,000 |
|
Wan Chai Reclamation (WCR)
Shoreline Zone |
||||
|
WCR Stage 1 See Note (3) |
2010 |
1,500 |
94 |
10,500 |
|
WCR Stage 2 |
2012 |
6,000 |
375 |
42,000 |
|
WCR Stage 3 |
2013 |
1,500 |
94 |
10,500 |
|
WCR Stage 4 |
2013 |
6,000 |
375 |
42,000 |
|
|
||||
|
HKCEC Stage 1 |
2010 |
1,500 |
94 |
10,500 |
|
HKCEC Stage 2 |
2012 |
6,000 |
375 |
42,000 |
|
HKCEC Stage 3 |
2012 |
1,500 |
94 |
10,500 |
|
Dredging along pipelines |
||||
|
Cross Harbour Water Mains |
2010 –2011 |
1,500 |
94 |
10,500 |
|
Wan Chai East Submarine Sewage Pipeline |
2010 |
1,500 |
94 |
10,500 |
Note:
1. Dredging to be carried out by closed grab dredger (16 hours per day).
2. Silt curtains to be deployed around seawall dredging and seawall trench filling in NPR, WCR and HKCEC areas.
3. Reduced dredging rates of 1,500 m3 per day are applicable to construction of the western seawall of WCR Stage 1 which is close to the WSD Wan Chai intake. For construction of the remaining seawalls of WCR Stage 1, the maximum dredging rate of 6,000 m3 per day will be applied.
Dredging Works for Proposed Cruise Terminal at Kai Tak (CT Dredging)
3.72
Development of the proposed Kai Tak Cruise Terminal would require dredging at
the existing seawall at the southern tip of the former
3.73
The maximum dredging rate recommended during the
Stage 1 dredging period would be 8,000 m3 per day (including the
dredging of 4,000 m3 per day at or near the seawall for berth
construction using 2 closed grab dredgers plus the dredging of 4,000 m3
per day in the manoeuvring area for the Phase I Berth using another 2
closed grab dredgers). During the
Stage 2 dredging period, 2 closed grab dredgers will be in operation
simultaneously with a maximum production rate of 4,000 m3 per
day. Silt curtains would be
deployed around the two closed grab dredgers used for dredging at or near the
existing seawall of the former
Public Landing Steps cum Fireboat Berth under the KTD Project
3.74
A section of the existing seawall at the former
Runway Opening under the KTD Project
3.75
Opening a 600m wide gap at the northern section
of the former
3.76 Demolition of existing runway will involve excavation of bulk fill and dredging to -5mPD. The proposed construction method adopts an approach where the existing seawall at the runway will not be removed until completion of all excavation and dredging works for demolition of the runway. Thus, excavation of bulk fill and majority of the dredging works will be carried out behind the existing seawall, and the sediment plume can be effectively contained within the works area. Demolition of existing seawall will involve removal of gravel only, which would not create significant SS impact. Fines content in the filling materials in the seawall would be negligible and loss of fill material during seawall demolition is not expected.
3.77 As there is likely some accumulation of sediments alongside the runway, there will be a need to dredge the existing seabed after completion of all the demolition works. Thus, potential water quality impact of SS will arise from the dredging on either side of the 600m opening. Based on the latest information, dredging alongside the 600m opening will be carried out at a maximum production rate of 2,000m3 per day using one closed grab dredger.
3.78
Based on the latest information, removal of
existing seawalls and dredging at the 600m runway opening is tentatively
scheduled to commence in early 2014. Localized dredging would also need to be
undertaken on either side of the 600m opening. Localized dredging on the side fronting
Disused Fuel Dolphin under the KTD Project
3.79
There is a disused fuel dolphin at inner
Installation of Submarine Gas Pipelines from Ma Tau Kok
to North Point for
3.80
Twin 400mm diameter steel submarine gas
pipelines are currently aligned 235m west of and parallel to the former
3.81 The dredging associated with removal of the existing submarine gas mains will be incorporated into the Stage 2 works of the CT Dredging (refer to Sections 3.72 and 3.73) and the earliest possible time for the Stage 2 dredging would be 2013 to 2014. Based on the latest information, dredging of seabed for construction of the New Submarine Gas Main would be conducted in 2012 at a maximum rate of 4,000m3 per day. The construction of the New Submarine Gas Main is a designated project and the cumulative environmental impacts associated with the gas main construction will be examined in detail under separate EIA study.
Road T2 and
3.82
It should be noted that the Central Kowloon
Route (CKR) and Road T2 will join up to provide an east-west road link across
3.83
In view that the section of CKR alignment is
small, it is assumed that dredging and backfilling would be conducted in
sequence rather than occurring at the same time. Based on the latest
information obtained from Highway Department in July 2010, the expected
construction period for CKR would be 2012 to 2016. In view of the potential
contamination of sediment in the
3.84 The dredging and filling activities for construction of Road T2 would be at a larger scale. Road T2 is still under planning and EIA stage and its construction could be carried out at the same time in the period from 2012 to 2013 the earliest. Based on the latest information ([4]), dredging for Road T2 would be conducted at a maximum rate of 8,000m3 per day (using four grab dredgers) at the same time when sand filling is conducted at a maximum rate of 4,000m3 per day (using another four grab dredgers). Removal of the existing breakwater and subsequent reinstatement need to be allowed for construction of Road T2. The plant used for removing and reinstating the breakwater would be similar to the plant used for dredging marine sediments. The material being dredged from the breakwaters will be largely rockfill which will have low fines content and therefore much less water quality impact than dredging of the adjacent muds. The Road T2 project is also a designated project and the cumulative environmental impacts associated with the Road T2 will be examined in detail under separate EIA study.
Dredging at
3.85 The objective of the Project is to carry out necessary dredging work in KTCB and portions of Western Fairway and Northern Fairway. However, as the proposed dredging in KTCB is located more than 8 km away from the Project site outside the Victoria Harbour channel, the associated cumulative water quality effects from this dredging work is considered insignificant. The proposed dredging in KTCB is therefore not included in this modeling exercise. The proposed dredging work is a designated project and the cumulative environmental impacts associated with this dredging work will be examined in detail under separate EIA study.
Laying of
3.86
A new cross-harbour
water main would be constructed to provide security of water supply from
Lei Yue Mun Waterfront Enhancement
3.87
A new landing facility will be built at Lei Yue Mun under this water
enhancement project. Construction
of the landing facility would require dredging off the landing area and
construction of a new breakwater.
Based on the modelling results provided in the
Preliminary Environmental Review Report for this waterfront enhancement
project, the operation of the proposed landing facility and breakwater would
not change the overall flow regime in the
Container Terminal 10
3.88 Based on the Project Profile for Container Terminal No. 10 (CT10), the preliminary feasibility study for CT10 would commence in early 2009 for completion in late 2011. Hence, the design information for CT10 including the implementation programme, reclamation layout, construction design and methods (e.g. the production rate for dredging activities) is currently unconfirmed. In addition, the CT10 would be located outside the harbour channel and far away (more than 8 km) from the Project site. The cumulative water quality impact from the CT10 construction is considered to be minor. Therefore, the CT10 reclamation will not be further considered in the sediment plume modelling.
Other Concurrent Projects
3.89 It should be noted that no dredging activity is anticipated for the Harbour Area Treatment Scheme (HATS) Stage 2A. All the marine activities for Central Reclamation Phase III (CRIII) will be completed before construction of the SCL Protection Works.
Sediment Plume Modelling Scenarios
3.90 As identified in Section 3.50, the proposed modelling scenario should cover the worst case sediment plume impact upon the local water quality within the CBTS during the dredging for Protection Works at PW1.1. Based on the tentative construction programme for concurrent projects as identified above, dredging at PW1.1 would potentially occur in 2012 together with the CT Dredging (Stage 1), construction of the trunk Road T2, Central Kowloon Route (CKR), New Submarine Gas Main and Western Harbour Main as well as the dredging for Wan Chai Reclamation and HKCEC Reclamation under the WDII project.
3.91 Hence, the proposed modelling scenario assumes that the following marine works will take place concurrently in 2012.
Ÿ Dredging at PW1.1 (within the CBTS) under the SCL Protection Works
Ÿ CT Dredging (Stage 1) under the KTD project
Ÿ Dredging and sand filling for Road T2 construction
Ÿ Dredging for CKR
Ÿ Dredging for New Submarine Gas Main
Ÿ Dredging
for
Ÿ Dredging for Wan Chai Reclamation (WCR) under the WDII project
Ÿ Dredging for HKCEC Reclamation under the WDII project
3.92
The key purpose of this scenario is to
investigate the potential worst case local water quality impact upon Intake 8
close to the dredging work at PW1.1.
As previously mentioned, PW1.1 would be conducted in marine embayment
partially enclosed by the breakwater which would be isolated from the majority
of the water quality effects from other concurrent dredging activities in the
open harbour.
Hence, this scenario (with consideration of other potential concurrent
dredging activities in the open harbour) would
provide a conservative assessment.
Any possible change in the construction programme
of other concurrent projects in the open
Locations of Sediment Spill Sources
Dredging for Temporary Reclamation within the CBTS under the SCL Protection Works
3.93 One spill source (namely A16 as shown in Figure No. NEX2213/C/331/ENS/M59/505) is assumed under Scenario 1 to represent 2 closed grab dredgers operated within the temporary embayment at the western corner of the CBTS to address the worst-case impact upon the nearby cooling water intake (namely Intake 8) from the SCL Protection Works.
Dredging Works for Proposed Cruise Terminal at Kai Tak (CT Dredging) Stage 1
3.94 Four spill locations (namely A3, A4, A5 and A6 respectively as shown in Figure No. NEX2213/C/331/ENS/M59/505) are assumed under the modeling scenario for the Stage 1 dredging works with reference to the approved EIA for CT Dredging. Alternative spill locations within the proposed dredging area have been assessed under the approved EIA for CT Dredging and the assessment results indicated that no significant difference in the predicted SS levels was found between the alternative scenarios.
Dredging and Sand Filling for Road T2
3.95 Construction of Road T2 would include four grab dredgers for dredging and another four for sand filling. Dredging would be the most critical activities and the associated sediment release points are included in the area outside the breakwaters of Kwun Tong Typhoon Shelter (KTTS) for worst case assessment. For the purpose of water quality modelling, only two source points (namely A7 and A8 respectively as shown in Figure No. NEX2213/C/331/ENS/M59/505), are assumed to represent the dredging work and each source point would cover the sediment loss from two grab dredgers. Two sand filling points (namely A9 and A10) are included inside the KTTS breakwater and each source point would cover the sediment loss from two grab dredgers.
Dredging for CKR
3.96
One spill source (namely A15 as shown in Figure No. NEX2213/C/331/ENS/M59/505)
is assumed to be located at the inner
Installation of Submarine
Gas Pipelines from Ma Tau Kok to North Point for
3.97
For the New Submarine Gas Main, the sediment
release point (namely A17 as shown in Figure
No. NEX2213/C/331/ENS/M59/505)
was chosen at a location in the fairway near the
3.98 For the Western Harbour Main, one sediment discharge location (namely A20 as shown in Figure No. NEX2213/C/331/ENS/M59/505) is selected at the middle of the harbour channel where high tidal flow rate would carry the sediment-laden marine water further away.
Dredging for Wan Chai Reclamation (WCR) under the
WDII Project
3.99 One sediment source (namely A12) for WDII is included in the modelling scenario to represent the dredging for WCR. As identified under the approved WDII & CWB EIA, the worst case impact during the WCR would be during the dredging along the seawall of WCR Stage 1 which could potentially affect the existing cooling water intake of Sun Hung Kai Centre and the WSD Wan Chai flushing water intake, These existing intakes are located within the site boundary of WCR Stage 2 and would be diverted to the new waterfront in a more open water environment after the reclamation works for WCR Stage 1 are completed. Hence, under this modelling exercise, the sediment source (namely A12) is assumed to be located along the western seawall of WCR Stage 1 for worst case assessment, following the approach adopted in the approved WDII & CWB EIA. The corresponding source location is given in Figure No. NEX2213/C/331/ENS/M59/505.
Dredging for HKCEC Reclamation under the WDII Project
3.100 One sediment source (namely A11) for WDII is included in the modelling scenario to represent the dredging for HKCECE Stage 2. The corresponding source location is given in Figure No. NEX2213/C/331/ENS/M59/505.
Sediment Loss Rates
3.101 Sediment loss rates for the dredging in the CBTS were estimated based on the assumptions listed below:
Ÿ The dry density of harbour mud is 1,600 kg/m3, based on the results of geotechnical site investigation conducted under the WDII & CWB project;
Ÿ Spill loss during mud dredging by closed grab dredger will be continuous, 16 hours a day, 6 days per week;
Ÿ With respect to rate of sediment loss during dredging, the Contaminated Spoil Management Study ([5]) (Mott MacDonald, 1991, Table 6.12) reviewed relevant literature and concluded that losses from closed grab dredgers were estimated at 11 – 20 kg/m3 of mud removed. Taking the upper figure of 20 kg/m3 to be conservative, the loss rate in kg/s was calculated based on the daily volume rate of dredging. (Assuming a dry density for marine mud of 1,600 kg/m3, the sediment loss during dredging is equivalent to a spill amount of approximately 1.25%);
Ÿ Spillage of mud dredged by closed grab dredgers is assumed to take place uniformly over the water column;
3.102 The calculated sediment loss rates for the modeling scenario are shown in Table 3.7. The corresponding source locations are indicated in Figure No. NEX2213/C/331/ENS/M59/505. The loss rates shown in Table 3.7 for CT dredging, dredging and sand filling for Road T2 construction, dredging for CKR, Western Harbour Main, WDII as well as the dredging work within the CBTS are the reduced loss rates under the mitigated scenario which have considered the effect of silt curtains.
Table 3.7 Maximum Dredging Rates
|
Concurrent Source ID (See Note A and Figure No. NEX2213/C/331/ENS/M59/505) |
Activity |
Approximate Duration |
Production Rate (m3 per day) |
Sediment Loss Rate (kgžs-1) |
|
Dredging at PW1.1 (within the CBTS) under the SCL Protection Works |
||||
|
A16 |
Dredging (2 closed grab dredger of about 8 m3 capacity each) |
10 days |
6,000 |
0.52 |
|
Dredging Works for Proposed Cruise Terminal at Kai Tak (CT Dredging) Stage 1 |
||||
|
A3 |
Based on the information available in the approved EIA for CT Dredging |
0.93 |
||
|
A4 |
0.93 |
|||
|
A5 |
Based on the information available in the approved EIA for CT Dredging |
0.23 |
||
|
A6 |
0.23 |
|||
|
Dredging for Road T2 |
||||
|
A7 |
Based on the information available from the Road T2 project |
0.46 |
||
|
A8 |
0.46 |
|||
|
Sand Filling for Road T2 |
||||
|
A9 |
Based on the information available from the Road T2 project |
0.19 |
||
|
A10 |
0.19 |
|||
|
Dredging for CKR |
||||
|
A15 |
Based on the information available from the CKR project (See Note B) |
0.23 |
||
|
Dredging for New Submarine Gas Main |
||||
|
A17 |
Based on the information available in the approved EIA for CT Dredging (See Note C) |
2.31 |
||
|
Dredging for |
||||
|
A20 |
Based on the information available from the Western Harbour Main project |
0.23 |
||
|
Dredging for HKCEC Stage 2 under the WDII Project |
||||
|
A11 |
Based on the information available from the WDII & CWB project |
0.52 |
||
|
Dredging for Wan Chai Reclamation Stage 1 under the WDII Project |
||||
|
A12 |
Based on the information available from the WDII & CWB project (see Note D) |
0.13 |
||
Note A The assumed sediment loss rates for Source ID
A5, A6, A7, A8, A9, A10, A11, A12, A15, A16, A20 are the reduced loss rate
after considering the effect from deployment of silt curtain. No silt curtain
is assumed to be deployed for Source ID A3, A4 and A17.
Note B Based on latest information from the CKR
project, the dredging rate for CKR would be 1000 m3 per day with
deployment of silt curtain. The
calculated sediment loss rate presented in this table is however based on a
production rate of 2000 m3 per day with deployment of silt curtain,
which is a conservative approach.
Note C Based on the latest information from the New
Submarine Gas Main project, sediment loss from dredging should be calculated
based on a dredging rate of 4000 m3 per day. The sediment loss rate adopted in this modelling exercise for the New Submarine Gas Main is
however based on the data from the approved EIA for CT dredging, assuming that
the dredging would be carried out at a rate of 5000 m3 per day (with
no deployment of any silt curtain), which is a conservative assumption.
Note D Based on the approved WDII and CWB EIA,
the maximum production rate for dredging at the Wan Chai
Reclamation (WCR) Stage 1 should be 6000 m3/d except for the
dredging along the western seawall of WCR Stage 1 where the maximum production
rate should be reduced to 1500 m3/day (under the mitigated scenario)
to minimize the potential impact to the WSD Wan Chai
intake. Based on the sediment plume model results available from the approved
WDII and CWB EIA, the influence zone of the dredging work in both the CBTS and
the shoreline reclamation zone of Wan Chai (with low
current velocity and deployment of silt curtain) would be localized and would
not affect each other, even under the maximum production rate of 6000 m3/d. Under this EIA, the sediment source
point for Wan Chai Reclamation was chosen at the
western seawall of WCR Stage 1 which is closest to the WSD Wan Chai intake. Thus the calculated sediment loss rate for
this source point (A12) is based on the maximum production rate of 1500 m3/day
recommended under the mitigated condition.
It is considered that the possible change in the dredging rate from 1500
to 6000 m3/day within the shoreline zone of WCR Stage 1 would not
affect the conclusion and outcome of this modelling
exercise.
Model Coverage Area and Grid Schematization
3.103 Computer
modelling is used to assess the potential impacts on
water quality in
3.104 The
Delft3D Victoria Harbour (VH) model is used as the
basis for hydrodynamic and water quality modelling. The VH model was extensively calibrated
and fully verified by comparing computational results with field
measurements. The grid mesh of the
VH model has a high resolution (approximately
3.105 The coverage and grid layout of the VH model are shown in Figures C1a and C1b of Appendix 3.3. The grid quality at the area near the Project site is presented in Figures C2 and C3 of Appendix 3.3 for orthogonality and smoothness. The coverage and resolution of this VH model are considered adequate for use under the present water quality assessment study.
3.106 The grid quality of the VH model is generally good except in some areas at or close to the land boundary and marine embayments. The flow velocities at the closed grid cells along the land boundary are generally small. The velocities at or near the land boundary along the coastlines would be less than 0.5 m/s at mid-flood/mid-ebb and less than 0.1 m/s at most of the times. In view of the small velocity, numerical errors associated with the change of orthogonality and smoothness should be small. Therefore, it is considered appropriate to adjust the grid line to represent the coastal features (rather than keeping these closed grid cells orthogonal or smooth). Orthogonality and smoothness at open grid cells has been checked to be adequate.
Coastline Configurations
Within the Assessment Area
3.107 Based on the information on the planned developments from the EIA Reports registered under the EIAO, there would not be any major change in the coastline configuration within the assessment area namely Victoria Harbour WCZ.
3.108 Based
on the latest information, seawall construction for most of the WDII
reclamation stages will be completed in 2013. The coastlines to be adopted under this modelling exercise will include partially reclaimed
lands. Model results from the
approved WDII & CWB EIA indicated that the net effect of the WDII & CWB
reclamations on the tidal flow in
3.109 It
should be noted that the “no reclamation” scenario will be adopted for the Kai Tak Development (KTD) based on the approved EIA for
KTD. The proposed runway opening is
more than 2 km away from the Project site. The approved EIA for KTD indicated
that the runway opening to be implemented under the KTD would not change the
overall flow regime in the
3.110 The reclamation for Yau Tong Bay Reclamation (YTBR) is excluded as it is still subject to planning review. The coastline configurations to be adopted in the modelling for the modeling scenario is indicated in Figure No. NEX2213/C/331/ENS/M59/506.
Outside the Assessment Area
3.111 For
the hydrodynamic modelling of this EIA, a regional
model was setup to cover the whole of
Table 3.8 Summary of Planned Coastal Developments Outside the Assessment Area
|
Coastal Developments to be included in the Regional Model |
Information Source |
|
Sunny Bay Reclamation |
EIA Report for “Northshore Lantau Development Feasibility Study” (Register No.: AEIAR-031/2000) |
|
Tuen Mun - Chek Lap Kok Link (TMCLKL) |
Project Profile for “Tuen Mun - Chek Lap Kok Link” (Study Brief No. ESB-175/2007) |
|
Further Development of Tseung |
EIA Report for “Further
Development of Tseung |
|
Hong Kong – Zhuhai – |
EIA Study Brief for “Hong
Kong – Zhuhai – |
3.112 Site
selection for the Integrated Waste Management Facilities (IWMF) is still
unconfirmed and therefore will not be included in the modelling. Under this modelling
exercise, reclamations for
Uncertainties in Assessment Methodology
3.113 Quantitative uncertainties in the modelling were considered when making an evaluation of the modelling predictions. The following approach has been adopted to enhance the model performance:
Ÿ The
computational grid of the detailed Victoria Harbour
(VH) Model was refined along the coastline of Wan Chai,
Ÿ The performance of the detailed VH Model was checked against the results of a fully calibrated model adopted under the approved WDII & CWB EIA to ensure that reliable predictions of hydrodynamics are provided for the Study area;
Ÿ The simulation comprises a sufficient spin up period so that the initial conditions do not affect the results.
Sediment Plume Modelling
3.114 Sediment
plumes arising from the mud dredging and filling activities during the marine
construction works are simulated using Delft3D-PART. This model has been used for sediment
plume modelling in a number of previous reclamation
studies in
3.115 The loss of fines to the water column during dredging and filling operations is represented by discrete particles in the model. These discrete particles are transported by advection, due to the tidal flows determined from hydrodynamic simulation, and turbulent diffusion and dispersion, based on a random walk technique. The refined VH Model is used to provide the hydrodynamic information for particle tracking.
3.116 The Delft3D-PART model takes into account the sedimentation process by means of a settling velocity, while erosion of bed sediment, causing resuspension of sediment, is governed by a function of the bed shear stress. The parameters adopted in the present Study are summarized in Table 3.9. The construction Delft3D-PART scenario was simulated with three typical spring-neap tidal cycles for spin-up and one cycle for actual simulation in both dry and wet seasons following the approach adopted under the approved WDII & CWB EIA.
Table 3.9 Summary of Parameters for Sediment Plume Model (Delft3D-PART)
|
Sediment Plume Model Parameters |
||
|
Horizontal Dispersion Coefficient DH (m2žs-1) |
a = 0.003 b = 0.4 |
DH = a t b, Where t is the age of particle from the instant of discharge in seconds |
|
Vertical Dispersion Coefficient DV (m2žs-1) |
5x10⁻³ 1x10⁻⁵ |
Dry Season Wet Season |
|
Particle Settling Velocity |
0.0001 mžs-1 (Constant) |
Grain size diameter of 10 mm |
|
Critical Shear Stress |
0.05 Pa 0.15 Pa |
Sedimentation Erosion |
Land-based Construction
3.117 The water sensitive receivers that may be affected by the land-based construction activities have been identified. Potential sources of water quality impact that may arise during the land-based construction activities were described. This task included identifying pollution sources that could affect the quality of surface water run-off. All the identified sources of potential water quality impact were then evaluated and their impact significance determined. The need for mitigation measures to reduce any identified adverse impacts on water quality to acceptable levels was determined.
Prediction and Evaluation of Environmental Impacts
Marine Construction
Suspended Solids
Seawater Intakes
3.118 A sediment dispersion scenario was modelled, as defined in Table 3.7. The construction scenario was simulated with three typical spring-neap tidal cycles for spin-up and one cycle for actual simulation in both dry and wet seasons. The results for SS levels predicted at the water sensitive receivers for dry season and wet seasons, taken into account the background SS concentrations, are shown in Table 3.10. The 90 percentile SS level predicted at the corresponding indicator points under the pre-construction scenario is used as the background SS concentrations for conservative predictions.
3.119 Absolute maximum and tidal-averaged SS concentrations predicted over a spring-neap cycle at the seawater intakes are presented in Table 3.10. The SS levels predicted in Table 3.10, have incorporated the effects of mitigation measures recommended for the WDII, CT Dredging, Road T2, CKR and Western Harbour Main including the deployment of silt curtains around the dredging / filling works and deploying silt screens at all the cooling water intakes located within the WDII & CWB works boundaries (namely 1, 2, 3, 4, 5, 6, 7, 8 and 9) as well as the WSD flushing water intakes close to the marine works (namely WSD7, WSD9, WSD10, WSD15, WSD17, WSD19 and A). Locations of these seawater intakes are shown in Figure No. NEX2213/C/331/ENS/M59/501 and Figure No. NEX2213/C/331/ENS/M59/502.
3.120 According to the Contaminated Spoil Management Study ([6]), the implementation of silt curtain around the closed grab dredgers will reduce the dispersion of SS by a factor of 4 (or about 75%). Similarly, the implementation of silt screen at the intake could reduce the SS level by a factor of 2.5 (or about 60%), based on the values established under the Pak Shek Kok Reclamation, Public Dump EIA (1997). These SS reduction factors (75% for silt curtains and 60% for silt screens) have been adopted in a number of recent studies, including the approved WDII & CWB EIA, CT Dredging EIA as well as the Western Coast Road EIA study.
3.121 As shown in Table 3.10, full compliance with SS criterion at all the cooling water intakes and WSD flushing water intakes would be achieved under the assessment scenario.
Table 3.10 Predicted Suspended Solids Concentrations at Seawater Intakes
|
WQ Sensitive
Receivers (ID) |
SS concentration (absolute value) in mid-depth (mg/l) |
||||||
|
Criterion |
Dry Season |
Wet Season |
|||||
|
Mean |
Maximum |
% time in compliance |
Mean |
Maximum |
% time in compliance |
||
|
Cooling Water Intakes |
|||||||
|
MTR Tsing
Yi Station (C12) |
< 40 |
5.99 |
8.42 |
100.00% |
7.62 |
10.16 |
100.00% |
|
Daily Farm Ice Plant (C22) |
- |
4.81 |
9.00 |
- |
6.48 |
9.04 |
- |
|
Pamela Youde
Nethersole Eastern Hospital (C23) |
- |
4.02 |
4.58 |
- |
5.50 |
6.53 |
- |
|
Prince's Building Group
(C29) |
- |
5.57 |
8.17 |
- |
8.45 |
15.15 |
- |
|
|
- |
5.23 |
8.80 |
- |
8.57 |
29.80 |
- |
|
Queensway Government Offices
(C31) |
- |
2.23 |
3.20 |
- |
3.49 |
16.89 |
- |
|
MTR New South Intake (C32) |
< 40 |
2.18 |
3.21 |
100.00% |
3.32 |
6.37 |
100.00% |
|
Kai Tak
DCS (C33) |
- |
4.42 |
4.49 |
- |
7.18 |
12.87 |
- |
|
|
- |
2.13 |
3.54 |
- |
3.10 |
6.85 |
- |
|
Telecom
House / HK Academy for Performing / Shui On Centre
(Existing) (2) See Note (3) |
- |
2.32 |
4.09 |
- |
3.30 |
8.12 |
- |
|
|
- |
1.90 |
2.30 |
- |
3.04 |
6.91 |
- |
|
Wan
|
- |
1.90 |
2.31 |
- |
2.97 |
4.55 |
- |
|
Great
Eagle Centre / |
- |
4.75 |
5.82 |
- |
7.37 |
11.97 |
- |
|
Sun
Hung Kai Centre (Existing) (6) See Note (3) |
- |
2.11 |
3.15 |
- |
3.15 |
5.08 |
- |
|
Excelsior
Hotel & World Trade Centre / |
- |
2.91 |
4.36 |
- |
7.22 |
22.11 |
- |
|
|
- |
2.99 |
2.99 |
- |
3.77 |
11.72 |
- |
|
|
- |
4.76 |
7.90 |
- |
6.98 |
10.79 |
- |
|
Provident
Centre (12) |
- |
4.97 |
8.82 |
- |
7.26 |
12.32 |
- |
|
MTR
( |
< 40 |
4.94 |
6.18 |
100.00% |
7.24 |
9.41 |
100.00% |
|
|
- |
5.04 |
6.22 |
- |
7.11 |
8.81 |
- |
|
|
- |
4.87 |
5.35 |
- |
7.13 |
12.50 |
- |
|
Ocean
Centre (17) |
- |
4.86 |
5.31 |
- |
7.09 |
13.82 |
- |
|
Ocean
Terminal (18) |
- |
4.91 |
6.55 |
- |
7.32 |
11.04 |
- |
|
Government
Premises (19) |
- |
4.94 |
6.45 |
- |
7.70 |
12.93 |
- |
|
|
- |
5.19 |
7.28 |
- |
9.08 |
14.23 |
- |
|
East
Rail Extension (21) |
< 40 |
4.67 |
5.79 |
100.00% |
6.80 |
8.17 |
100.00% |
|
Metropolis
(34) |
- |
4.48 |
5.57 |
- |
6.45 |
10.04 |
- |
|
|
- |
4.51 |
6.01 |
- |
6.49 |
9.54 |
- |
|
|
< 40 |
4.75 |
6.01 |
100.00% |
7.01 |
8.87 |
100.00% |
|
Saltwater
Intakes |
|||||||
|
|
< 10 |
5.38 |
5.73 |
100.00% |
8.16 |
9.77 |
100.00% |
|
Tai
Wan (WSD9) See Note (3) |
< 10 |
1.86 |
2.85 |
100.00% |
2.16 |
3.42 |
100.00% |
|
Cha
Kwo Ling (WSD10) See Note (3) |
< 10 |
1.74 |
2.30 |
100.00% |
2.19 |
3.44 |
100.00% |
|
Tseung Kwan O (WSD12) |
< 10 |
3.69 |
3.70 |
100.00% |
4.79 |
5.29 |
100.00% |
|
Siu Sai Wan (WSD13) |
< 10 |
4.00 |
4.24 |
100.00% |
5.51 |
7.77 |
100.00% |
|
Sai Wan Ho (WSD15) See Note (3) |
< 10 |
1.83 |
2.73 |
100.00% |
2.49 |
3.83 |
100.00% |
|
|
< 10 |
1.92 |
2.57 |
100.00% |
2.68 |
4.56 |
100.00% |
|
Sheung Wan (WSD19) See Note (3) |
< 10 |
2.16 |
2.45 |
100.00% |
3.05 |
4.86 |
100.00% |
|
|
< 10 |
5.26 |
6.41 |
100.00% |
7.14 |
7.44 |
100.00% |
|
Wan
Chai (Existing) (A) See Note (3) |
< 10 |
1.91 |
2.61 |
100.00% |
3.05 |
6.99 |
100.00% |
|
|
< 10 |
4.96 |
7.40 |
100.00% |
7.22 |
9.32 |
100.00% |
Notes:
1. The water quality modelling results for 90 percentile SS predicted under the pre-construction scenario at the corresponding indicator points is adopted as the ambient SS levels.
2. Other seawater intakes that are not shown in this table were found not be impacted by the proposed marine works for SCL Protection Works
3. The SS levels predicted at this specific intake has incorporated the effect from deployment of silt screen around the intake as recommended under the approved WDII & CWB EIA and CT Dredging EIA, refer to Section 3.119
Important Coral Communities
3.122 The SS elevations and sedimentation rates predicted at the far-field coral communities with great ecological conservation value are provided in Table 3.11. It should be highlighted that the maximum SS elevations and the maximum sedimentation rates presented in the table represent the maximum values predicted over the entire simulation. Both the SS elevations and sedimentation rates would comply with the relevant criteria at all the coral sites.
Table 3.11 Predicted Suspended Solids Elevations and Sedimentation Rates at Corals
|
Corals (ID) (refer to
Figure No. NEX2213/C/331/ENS/M59/507) |
Maximum SS Elevations
(mg/L) |
Maximum Sedimentation Rate
(g/m2/day) |
||
|
Criterion (30% of Mean SS Level) |
Maximum |
Criterion |
Maximum |
|
|
Dry
Season |
||||
|
|
1.70 |
1.61 |
<
100 |
40.46 |
|
Chiu
Keng Wan (C3) |
1.07 |
0.31 |
<
100 |
27.18 |
|
Fat
Tong Chau (C4) |
1.10 |
0.93 |
<
100 |
7.83 |
|
Tseung |
1.08 |
0.02 |
<
100 |
2.20 |
|
Wet
Season |
||||
|
|
2.76 |
0.95 |
<
100 |
7.76 |
|
Chiu
Keng Wan (C3) |
1.95 |
1.02 |
<
100 |
19.64 |
|
Fat
Tong Chau (C4) |
1.96 |
1.23 |
<
100 |
15.46 |
|
Tseung |
2.14 |
1.81 |
<
100 |
15.03 |
3.123 The contour plots presented in Appendix 3.4 to Appendix 3.5 show the extent of surface, mid-depth and bottom SS elevations averaged over a spring-neap cycle, during wet and dry seasons.
Compliance with WQO for SS Elevation
3.124 Non-compliance
with the WQO for SS (i.e. elevation of less than 30% of ambient baseline level)
would be predicted in the
Potential Contaminant Release during Dredging
Silver, Cadmium, Copper, Nickel, Lead, Chromium, Mercury,
Arsenic, TBT and Chlorinated Pesticides
3.125 This section provides the assessment of contaminant release during dredging for silver, cadmium, copper, nickel, lead, chromium, mercury, arsenic, TBT and chlorinated pesticides. Contaminant release for zinc, PCBs and PAHs are separately assessed in later sections. An indication of the likelihood of release of contaminants from the marine mud during dredging is given by the results of the elutriation tests from the laboratory testing conducted under the marine SI for selected sediment sampling stations within the marine works areas. Sediment samples mixed with a solution, i.e. the ambient seawater collected from the same site, were vigorously agitated during the tests to simulate the strong disturbance to the seabed sediment during dredging. Pollutants absorbed onto the sediment particles would be released and increasing the pollutant concentrations in the solution. The laboratory testing was to analyse the pollutant concentrations in the solution (elutriate). If the contaminant levels are higher in the elutriates in comparison with the blanks (i.e. marine water from the same site), it can be concluded that the contaminants are likely to be released into the marine waters during dredging activities. The elutriate samples were tested for heavy metals and tributyltin (TBT) as well as chlorinated pesticides. Details of the sediment quality and elutriate sampling and testing are reported separately in the Sediment Sampling and Testing Plan (SSTP) as given in Appendix 6.3. Laboratory results for the elutriation tests are shown in the Table 3.12. Locations of the sampling stations are shown in Figure No. NEX2213/C/331/ENS/M59/508 and Figure No. NEX2213/C/331/ENS/M59/509.
3.126 The concentrations of cadmium, copper, nickel, lead and TBT in the elutriate samples exceeded the assessment criteria. The highest concentrations of cadmium (3mg/L), copper (15mg/L), nickel (42mg/L), lead (35mg/L) and TBT (0.21mg/L) were all recorded at Station 2211/SCL/EDH-VC024. The levels of silver, chromium, arsenic and mercury in the elutriate samples complied well with the relevant water quality criteria.
3.127 Based on the elutriate testing results, the required dilutions to meet the assessment criteria were calculated to be 1.2 for cadmium, 3 for copper, 1.4 for nickel and lead and 2.1 for TBT. As exceedances for heavy metal and TBT were only recorded in a very small portion of elutriate samples, it is expected that any significant elevation of metal and TBT in the marine water during dredging would be highly transient. The contaminant concentrations in most of the elutriate test samples complied well with the assessment criteria. It is expected that any release of heavy metals during dredging will be quickly diluted by the large volume of marine water within the construction site. As the ecological value in CBTS is low, any potential impact due to contaminant elevation within the typhoon shelter should be limited. It is considered that the required dilution rate (maximum 3 times only) to meet the water quality standards could be easily achieved in the open harbour area with high flushing capacity, and the mixing zone of pollutants (in case if any) would be localized within CBTS. Thus, no unacceptable water quality impact would be anticipated due to the release of contaminants during dredging.
3.128 Chlorinated pesticides including alpha-BHC, beta-BHC, gamma-BHC, delta-BHC, heptachlor, Aldrin, heptachlor epoxide, endososulfan, p,p’-DDT, p,p’-DDD, p,p’-DDE, endosulfan sulphate, were also measured in both the sediment and elutriate samples. The laboratory results show that these pesticides were not detected in any of the sediment and elutriate samples. All the measured values are below the detection limit of 0.5 mg/kg for sediment and 0.1 mg/l for elutriate. Also, the elutriate test results do not indicate any levels higher than the blank results which indicated that the impact from the potential release of pesticides during dredging would not be an issue of concern.
Table 3.12 Comparison of Marine Site Investigation Sediment Elutriate Test Results with the Water Quality Standards
|
Vibrocore (Refer to Figure No. NEX2213/C/331/ENS/M59/508
- 509 |
Sampling
Depth (m) |
Parameters (mg/l) (2) |
||||||||
|
Silver |
Cadmium |
Copper |
Nickel |
Lead |
Chromium |
Arsenic |
Mercury |
TBT |
||
|
Assessment
Criteria (3) |
2.3 |
2.5 |
5 |
30 |
25 |
15 |
25 |
0.3 |
0.1 |
|
|
2211/SCL/EDH-VC019 |
0 - 0.95 |
< 2 |
< 1 |
< 5 |
< 10 |
< 10 |
< 10 |
< 25 |
< 0.1 |
<
0.013 |
|
1 - 1.95 |
< 2 |
< 1 |
< 5 |
< 10 |
< 10 |
< 10 |
< 25 |
< 0.1 |
<
0.014 |
|
|
2 - 2.95 |
< 2 |
< 1 |
< 5 |
< 10 |
< 10 |
< 10 |
< 25 |
< 0.1 |
<
0.015 |
|
|
3 - 3.95 |
< 2 |
< 1 |
< 5 |
< 10 |
< 10 |
< 10 |
< 25 |
< 0.1 |
<
0.014 |
|
|
6 - 6.95 |
< 2 |
< 1 |
< 5 |
< 10 |
< 10 |
< 10 |
< 25 |
< 0.1 |
<
0.014 |
|
|
9 - 9.95 |
< 2 |
< 1 |
< 5 |
< 10 |
< 10 |
< 10 |
< 25 |
< 0.1 |
<
0.015 |
|
|
12 - 12.95 |
< 2 |
< 1 |
< 5 |
< 10 |
< 10 |
< 10 |
< 25 |
< 0.1 |
<
0.012 |
|
|
Blank |
< 2 |
< 1 |
< 5 |
< 10 |
< 10 |
< 10 |
< 25 |
< 0.1 |
<
0.015 |
|
|
2211/SCL/EDH-VC024 |
0 - 0.9 |
< 2 |
< 1 |
< 5 |
< 10 |
< 10 |
< 10 |
< 25 |
< 0.1 |
0.21 |
|
1 - 1.9 |
< 2 |
< 1 |
< 5 |
< 10 |
< 10 |
< 10 |
< 25 |
< 0.1 |
< 0.012 |
|
|
2 - 2.9 |
< 2 |
1 |
15 |
42 |
35 |
< 10 |
< 25 |
< 0.1 |
< 0.010 |
|
|
3 - 3.9 |
< 2 |
< 1 |
< 5 |
< 10 |
< 10 |
< 10 |
< 25 |
< 0.1 |
< 0.012 |
|
|
6 - 6.9 |
< 2 |
< 1 |
< 5 |
< 10 |
< 10 |
< 10 |
< 25 |
< 0.1 |
< 0.011 |
|
|
9 - 9.9 |
< 2 |
< 1 |
< 5 |
< 10 |
< 10 |
< 10 |
< 25 |
< 0.1 |
< 0.012 |
|
|
12 - 12.9 |
< 2 |
2 |
< 5 |
< 10 |
< 10 |
< 10 |
< 25 |
< 0.1 |
<
0.012 |
|
|
15 - 15.9 |
< 2 |
3 |
< 5 |
< 10 |
< 10 |
< 10 |
< 25 |
< 0.1 |
<
0.011 |
|
|
18 - 18.9 |
< 2 |
1 |
< 5 |
< 10 |
< 10 |
< 10 |
< 25 |
< 0.1 |
<
0.012 |
|
|
21 - 21.9 |
< 2 |
1 |
< 5 |
< 10 |
< 10 |
< 10 |
< 25 |
< 0.1 |
<
0.012 |
|
|
Blank |
< 2 |
< 1 |
< 5 |
< 10 |
< 10 |
< 10 |
< 25 |
< 0.1 |
<
0.014 |
|
|
2211/SCL/VC028 |
0
- 1 |
< 2 |
< 1 |
< 5 |
< 10 |
< 10 |
< 10 |
< 25 |
< 0.1 |
<
0.013 |
|
Blank |
< 2 |
< 1 |
< 5 |
< 10 |
< 10 |
< 10 |
< 25 |
< 0.1 |
<
0.013 |
|
|
2211/SCL/MS001 |
0.0 - 0.9 |
< 2 |
< 1 |
< 5 |
< 10 |
< 10 |
< 10 |
< 25 |
< 0.1 |
0.025 |
|
0.9 - 1.9 |
< 2 |
< 1 |
< 5 |
< 10 |
< 10 |
< 10 |
< 25 |
< 0.1 |
0.025 |
|
|
Blank |
< 2 |
< 1 |
< 5 |
< 10 |
< 10 |
< 10 |
< 25 |
< 0.1 |
< 0.009 |
|
|
2211/SCL/MS004 |
0 - 0.9 |
< 2 |
< 1 |
< 5 |
< 10 |
< 10 |
< 10 |
< 25 |
< 0.1 |
0.11 |
|
1 - 1.9 |
< 2 |
< 1 |
< 5 |
< 10 |
< 10 |
< 10 |
< 25 |
< 0.1 |
<0.013 |
|
|
2 - 2.9 |
< 2 |
< 1 |
< 5 |
< 10 |
< 10 |
< 10 |
< 25 |
< 0.1 |
<0.013 |
|
|
3 - 3.9 |
< 2 |
< 1 |
< 5 |
< 10 |
< 10 |
< 10 |
< 25 |
< 0.1 |
0.016 |
|
|
6 - 6.95 |
< 2 |
< 1 |
< 5 |
< 10 |
< 10 |
< 10 |
< 25 |
< 0.1 |
0.058 |
|
|
9 - 9.95 |
< 2 |
< 1 |
< 5 |
< 10 |
< 10 |
< 10 |
< 25 |
< 0.1 |
<0.015 |
|
|
12 - 12.95 |
< 2 |
< 1 |
< 5 |
< 10 |
< 10 |
< 10 |
< 25 |
< 0.1 |
0.048 |
|
|
15 - 15.95 |
< 2 |
< 1 |
< 5 |
< 10 |
< 10 |
< 10 |
< 25 |
< 0.1 |
<0.013 |
|
|
18 - 18.95 |
< 2 |
< 1 |
< 5 |
< 10 |
< 10 |
< 10 |
< 25 |
< 0.1 |
<0.007 |
|
|
21 - 21.95 |
< 2 |
< 1 |
< 5 |
< 10 |
< 10 |
< 10 |
< 25 |
< 0.1 |
<0.015 |
|
|
Blank |
< 2 |
< 1 |
< 5 |
< 10 |
< 10 |
< 10 |
< 25 |
< 0.1 |
<0.009 |
|
Note:
1. Value in bold and shaded indicates exceedance of the Water Quality Standard.
2. Levels of chlorinated pesticides were all undetected and are therefore not presented.
3. Refer to Section 3.21.
Zinc, PCBs and PAHs
3.129 No valid elutriate testing results for zinc, PCBs and PAHs are available for assessment. The assessment of the release of zinc, PCBs and PAHs was made in relation to the sediment quality results (refer to Section 6). It is assumed in the assessment that all contaminants contained in the sediments that are lost to the water environment during dredging would instantaneously be released into the water column.
3.130 Inert tracers (with zero decay) were introduced into the Delft3D-WAQ model to represent the release of zinc, total PCBs and total PAHs during dredging. Discharge of inert tracers was assumed at the source point (discharge location). The assessment conducted under this EIA on the potential release of contaminants focused on the impact from the construction of SCL Protection Works alone.
3.131 Tracer simulation was performed for the construction scenario to determine the maximum dimensions of mixing zones for zinc, total PCBs and total PAHs. The simulation covered two model runs for dry and wet seasons respectively. Only one sediment source point (namely A16) is assumed for the SCL Protection Works under the modelling scenarios (refer to Figure No. NEX2213/C/331/ENS/M59/505). For calculating the release rate of zinc and PAHs, the sediment sampling results collected within the CBTS under the marine SI were used and the 90 percentile of contaminants measured in the sediment samples collected were used to calculate the loss rate source points for continuous model input. The zinc levels used for calculating the release rate for model input was 754.5 mg/kg. The total PAHs levels used for calculating the release rate for model input was 6240 mg/kg. All the PCBs levels measured in the sediment samples were undetected (i.e. < 3 mg/kg or < 30 mg/kg as shown in Appendix 6.4). The value of 30 mg/kg was used to calculate the PCBs loss rate for continuous model input as a conservative approach.
3.132 Appendix 3.8 shows the contour plots of maximum instantaneous zinc, total PCBs and total PAHs predicted over the entire simulation period for the assessment scenario. As shown in Appendix 3.8, exceedance of the assessment criteria would be localized and confined within the CBTS. As the model results are presented as the maximum values predicted over the entire simulation period, the area of mixing zones shown in the contour plots do not represent the actual maximum plume size. They are considered as the areas which envelop the moving plumes over the entire simulation period. The actual maximum instantaneous coverage of the mixing zone for these contaminants would be much smaller than that shown in the contour plots. Since there is no biological sensitive receiver within the CBTS and there are no areas of conservation value, ecological importance or mariculture activities in the vicinity, the localized plume of contaminants (which is confined within the CBTS) is not likely to cause any adverse ecological impact. The only affected water sensitive receivers are two cooling water intakes for the nearby building located within the CBTS, which are not sensitive to the elevated level of zinc, PCBs and PAHs. Thus, it is considered that no adverse marine water quality impact for zinc, PCB s and PAHs would be anticipated.
Oxygen Depletion During Dredging
3.133 An assessment of DO depletion during dredging is made in relation to the results of the sediment plume modelling of dredging activities and the sediment quality data for the study area. The predicted maximum elevations in SS concentrations at various indicator points were used to estimate the effects of increased SS concentrations on DO based on the equation stated below. The SS elevations used in the calculation for seawater intakes have not considered the effect of silt screen.
where DODEP = Dissolved oxygen (DO) depletion (mg/l)
C = Predicted maximum suspended solids (SS) concentration (mg/l)
SOD = Sediment oxygen demand (mg/kg)
K = Daily oxygen uptake factor (set as 1)
3.134 In the calculation, the daily oxygen uptake factor, K, was set to be 1, which means instantaneous oxidation of the sediment oxygen demand. This was a conservative prediction of DO depletion since oxygen depletion is not instantaneous. It is worth noting that the above equation does not account for re-aeration which would tend to reduce impacts of the SS on the DO concentrations in the water column.
3.135 The calculation was performed using the highest levels of 5-day SOD measured in the sediment samples collected during the SI for conservative predictions. The highest 5-day SOD level was recorded at station 2211/SCL/EDH-VC019 inside the CBTS. The 10 percentile DO predicted under the pre-construction scenario at the corresponding indicator points were used as the background levels, following the approach adopted under the approved WDII & CWB EIA. The proposed analysis, which is on the conservative side, will likely overestimate the DO depletion.
Oxygen Depletion at Water Sensitive
Receivers
3.136 The results of DO depletion for various WSRs are given in Table 3.13 for the dredging scenario.
Table 3.13 Calculation of the Effects of Increased Suspended Sediment Concentrations on Dissolved Oxygen Concentrations under the Assessment Scenario
|
Indicator
Point |
Maximum
Predicted SS Elevations (mg/L) |
SOD5
in Sediment (mg/kg) |
Maximum DO
Depletion (mg/L) |
Background
DO (mg/L) |
Resultant
DO (mg/L) |
|
Dry Season |
|||||
|
|
4.22 |
3,820 |
0.0161 |
6.63 |
6.61 |
|
Telecom House / HK Academy for Performing / Shui
On Centre (Existing) (2) |
5.50 |
3,820 |
0.0210 |
6.62 |
6.60 |
|
|
1.04 |
3,820 |
0.0040 |
6.65 |
6.65 |
|
Wan |
1.06 |
3,820 |
0.0040 |
6.65 |
6.65 |
|
Great Eagle Centre / |
1.10 |
3,820 |
0.0042 |
6.65 |
6.65 |
|
Sun Hung Kai Centre (Existing) (6) |
3.24 |
3,820 |
0.0124 |
6.65 |
6.64 |
|
Excelsior Hotel & World Trade Centre / |
3.72 |
3,820 |
0.0142 |
6.83 |
6.82 |
|
|
0.00 |
3,820 |
0.0000 |
6.82 |
6.82 |
|
Proposed HKAPA Extension (10) |
21.27 |
3,820 |
0.0812 |
6.62 |
6.54 |
|
|
3.42 |
3,820 |
0.0130 |
6.74 |
6.73 |
|
Provident Centre (12) |
4.36 |
3,820 |
0.0166 |
6.75 |
6.73 |
|
MTR ( |
1.34 |
3,820 |
0.0051 |
6.62 |
6.61 |
|
|
1.26 |
3,820 |
0.0048 |
6.62 |
6.62 |
|
|
0.49 |
3,820 |
0.0019 |
6.62 |
6.62 |
|
Ocean Centre (17) |
0.45 |
3,820 |
0.0017 |
6.62 |
6.62 |
|
Ocean Terminal (18) |
1.77 |
3,820 |
0.0067 |
6.62 |
6.61 |
|
Government Premises (19) |
1.68 |
3,820 |
0.0064 |
6.63 |
6.62 |
|
|
2.55 |
3,820 |
0.0097 |
6.62 |
6.61 |
|
East Rail Extension (21) |
1.15 |
3,820 |
0.0044 |
6.65 |
6.65 |
|
Metropolis (34) |
1.13 |
3,820 |
0.0043 |
6.65 |
6.65 |
|
|
1.57 |
3,820 |
0.0060 |
6.65 |
6.64 |
|
|
1.32 |
3,820 |
0.0050 |
6.62 |
6.61 |
|
|
0.40 |
3,820 |
0.0015 |
6.44 |
6.44 |
|
Tai Wan (WSD9) |
2.74 |
3,820 |
0.0105 |
6.71 |
6.70 |
|
Cha Kwo Ling (WSD10) |
1.59 |
3,820 |
0.0061 |
6.81 |
6.80 |
|
Tseung Kwan O (WSD12) |
0.00 |
3,820 |
0.0000 |
6.92 |
6.92 |
|
Siu Sai Wan (WSD13) |
0.25 |
3,820 |
0.0010 |
6.83 |
6.83 |
|
Sai Wan Ho (WSD15) |
2.74 |
3,820 |
0.0105 |
6.82 |
6.81 |
|
|
2.20 |
3,820 |
0.0084 |
6.82 |
6.81 |
|
Sheung Wan (WSD19) |
1.13 |
3,820 |
0.0043 |
6.46 |
6.46 |
|
|
1.26 |
3,820 |
0.0048 |
6.43 |
6.43 |
|
Wan Chai (Existing) (A) |
1.92 |
3,820 |
0.0074 |
6.65 |
6.64 |
|
|
2.56 |
3,820 |
0.0098 |
6.62 |
6.61 |
|
Wet Season |
|||||
|
|
10.23 |
3,820 |
0.0391 |
4.72 |
4.68 |
|
Telecom House / HK Academy for Performing / Shui
On Centre (Existing) (2) |
13.30 |
3,820 |
0.0508 |
4.72 |
4.67 |
|
|
10.29 |
3,820 |
0.0393 |
4.84 |
4.80 |
|
Wan |
4.38 |
3,820 |
0.0167 |
4.84 |
4.82 |
|
Great Eagle Centre / |
4.97 |
3,820 |
0.0190 |
4.84 |
4.82 |
|
Sun Hung Kai Centre (Existing) (6) |
5.70 |
3,820 |
0.0218 |
4.84 |
4.82 |
|
Excelsior Hotel & World Trade Centre / |
48.08 |
3,820 |
0.1837 |
5.27 |
5.09 |
|
|
21.82 |
3,820 |
0.0833 |
5.23 |
5.15 |
|
Proposed HKAPA Extension (10) |
27.37 |
3,820 |
0.1046 |
4.72 |
4.62 |
|
|
4.17 |
3,820 |
0.0159 |
4.85 |
4.83 |
|
Provident Centre (12) |
5.68 |
3,820 |
0.0217 |
4.85 |
4.83 |
|
MTR ( |
2.33 |
3,820 |
0.0089 |
4.81 |
4.80 |
|
|
1.79 |
3,820 |
0.0068 |
4.77 |
4.76 |
|
|
5.51 |
3,820 |
0.0211 |
4.77 |
4.75 |
|
Ocean Centre (17) |
6.84 |
3,820 |
0.0261 |
4.77 |
4.74 |
|
Ocean Terminal (18) |
3.96 |
3,820 |
0.0151 |
4.82 |
4.80 |
|
Government Premises (19) |
5.88 |
3,820 |
0.0224 |
4.8 |
4.78 |
|
|
7.34 |
3,820 |
0.0280 |
4.82 |
4.79 |
|
East Rail Extension (21) |
1.46 |
3,820 |
0.0056 |
4.77 |
4.76 |
|
Metropolis (34) |
3.75 |
3,820 |
0.0143 |
4.77 |
4.76 |
|
|
3.26 |
3,820 |
0.0124 |
4.77 |
4.76 |
|
|
1.95 |
3,820 |
0.0074 |
4.8 |
4.79 |
|
|
1.69 |
3,820 |
0.0064 |
4.85 |
4.84 |
|
Tai Wan (WSD9) |
3.77 |
3,820 |
0.0144 |
4.75 |
4.74 |
|
Cha Kwo Ling (WSD10) |
3.66 |
3,820 |
0.0140 |
4.62 |
4.61 |
|
Tseung Kwan O (WSD12) |
0.54 |
3,820 |
0.0020 |
5.51 |
5.51 |
|
Siu Sai Wan (WSD13) |
3.02 |
3,820 |
0.0115 |
5.41 |
5.40 |
|
Sai Wan Ho (WSD15) |
4.81 |
3,820 |
0.0184 |
4.95 |
4.93 |
|
|
6.49 |
3,820 |
0.0248 |
4.86 |
4.84 |
|
Sheung Wan (WSD19) |
5.01 |
3,820 |
0.0191 |
4.81 |
4.79 |
|
|
0.31 |
3,820 |
0.0012 |
5.03 |
5.03 |
|
Wan Chai (Existing) (A) |
10.49 |
3,820 |
0.0401 |
4.84 |
4.80 |
|
|
2.24 |
3,820 |
0.0086 |
4.81 |
4.80 |
3.137 No
significant DO depletion was predicted at the identified WSRs under the
assessment scenario. The concurrent
dredging activities would cause a maximum DO depletion of no more than 0.2 mg/L
at the nearby sensitive receivers.
Full compliance with the WQO for DO is predicted in the
Maximum Oxygen Depletion Near
the Dredging Site inside CBTS
3.138 The worst case oxygen depletion in CBTS caused by the Project activities would potentially occur near the dredging source point (namely A16) during dredging at PW1.1 within the temporary embayment formed by TS4 (See Figure No. NEX2213/C/331/ENS/M59/505). The maximum SS elevations predicted at source point A16 during the dredging work at PW1.1 was used to calculate the maximum oxygen depletion in this temporary embayment and the result is provided in Table 3.14 for depth-averaged and bottom DO under both dry and wet seasons. The background DO provided in Table 3.14 is the 10 percentile DO predicted under the pre-construction scenario at the corresponding indicator point. It was predicted that no significant DO depletion would occur in this temporary embayment during the dredging at PW1.1 and the resultant DO level would be > 4 mg/l.
Table 3.14 Maximum Effects on Dissolved Oxygen inside near the Dredging Site in CBTS
|
Indicator
Point (See Figure
No. NEX2213/C/331/ENS/M59/505) |
Season |
Water Layer |
Maximum
Predicted SS Elevations (at Source Point 16) Predicted from Sediment Plume Modelling (mg/L) |
SOD5
in Sediment (mg/kg) |
Maximum DO
Depletion (mg/L) |
Background
DO Based on the 10th Percentile Level Predicted under the
Pre-construction scenario (mg/L) |
Resultant
DO (mg/L) |
|
Source Point A16 |
Wet |
Depth-averaged |
145 |
3,820 |
0.55 |
5.23 |
4.68 |
|
Bottom |
182 |
3,820 |
0.69 |
4.94 |
4.25 |
||
|
Dry |
Depth-averaged |
49 |
3,820 |
0.19 |
6.82 |
6.63 |
|
|
Bottom |
89 |
3,820 |
0.34 |
6.21 |
5.87 |
Land Based Construction
Construction Site Run-off and General Construction Activities
3.139 Effluent discharge from temporary site facilities and construction site run-off should be controlled to prevent direct discharge to the neighbouring storm drains. Adoption of the guidelines and good site practices from the handling and disposal of construction discharges as part of the construction site management practices (as given in Sections 3.151 to 3.170) would minimize the potential impacts.
Accidental Spillage
3.140 The use of engine oil and lubricants, and their storage as waste materials has the potential to create impacts on the water quality if spillage occurs. Waste oil may infiltrate into the surface soil layer, or run-off into local water courses, increasing hydrocarbon levels. The potential impacts could however be mitigated by practical mitigation measures and good site practices (as given in Section 3.173 to 3.175 ).
Sewage from Construction Workforce
3.141 During construction, the increased workforce will contribute to the local population of the area. Impacts include the generation of rubbish and wastewater from temporary sanitary facilities and waste disposal areas. Although the impact will be temporary, this additional population may impose significant stress on the quality of water in local water courses in the absence of adequate mitigation. Mitigation measures and good site practices given in Sections 3.171 to 3.172 should be implemented.
Mitigation of Environmental Impacts
Marine Construction
Temporary Reclamation and Dredging within CBTS
3.142 The following measures have been implemented in the design of the proposed temporary reclamation and dredging within the CBTS to minimise the impacts on water quality:
Ÿ Temporary reclamation will adopt an approach where temporary seawalls will first be formed to enclose each phase of the temporary reclamation. Installation of diaphragm wall on temporary reclamation as well as any bulk filling will proceed behind the completed seawall. Any gaps that may need to be provided for marine access will be shielded by silt curtains to control sediment plume dispersion away from the site. Demolition of temporary reclamation including the demolition of the diaphragm wall and dredging to the existing seabed levels will also be carried out behind the temporary seawall. Temporary seawall will be removed after completion of all excavation and dredging works for demolition of the temporary reclamation.
Ÿ During construction of the temporary reclamation, temporary seawall will be partially constructed to protect the nearby seawater intakes from further dredging activities. For example, the seawalls along the southeast and northeast boundaries of PW1.1 should be constructed first (above high water mark) so that the seawater intake at the inner water would be protected from the impacts from the remaining dredging activities along the northwest boundary;
Ÿ Dredging will be carried out by closed grab dredger to minimize release of sediment and other contaminants during dredging;
Ÿ Silt curtains will be deployed to fully enclose the closed grab dredger during any dredging operation;
Ÿ Silt screens will be installed at the cooling water intakes within the CBTS during the temporary reclamation period;
Ÿ Site audit and water quality monitoring should be carried out at the seawater intakes during the dredging operations.
3.143 In addition, no more than two dredgers (of about 8 m3 capacity each) should be operated for dredging within the typhoon shelter at any time for SCL Protection Works. Moreover, the combined dredging rate for all concurrent dredging works to be undertaken within the CBTS shall not exceed 6,000 m3 per day throughout the entire construction period.
3.144 Typical configuration of silt curtains and silt screens, design and setup of silt curtain are shown in Appendix 3.9.
3.145 Other good site practices that should be undertaken during sand filling, public filling and dredging include:
Ÿ mechanical grabs, if used, should be designed and maintained to avoid spillage and sealed tightly while being lifted. For dredging of any contaminated mud, closed watertight grabs must be used;
Ÿ all vessels should be sized so that adequate clearance is maintained between vessels and the seabed in all tide conditions, to ensure that undue turbidity is not generated by turbulence from vessel movement or propeller wash;
Ÿ all hopper barges and dredgers should be fitted with tight fitting seals to their bottom openings to prevent leakage of material;
Ÿ construction activities should not cause foam, oil, grease, scum, litter or other objectionable matter to be present on the water within the site or dumping grounds;
Ÿ loading of barges and hoppers should be controlled to prevent splashing of dredged material into the surrounding water. Barges or hoppers should not be filled to a level that will cause the overflow of materials or polluted water during loading or transportation;
3.146 The following
mitigation measures are proposed to minimize the potential water quality
impacts from the construction works at or close to the seafront:
·
Temporary
storage of construction materials (e.g. equipment, filling materials, chemicals
and fuel) and temporary stockpile of construction and demolition materials
should be located well away from the seawater front and storm drainage during
carrying out of the works.
·
Stockpiling
of construction and demolition materials and dusty materials should be covered
and located away from the seawater front and storm drainage.
·
Construction
debris and spoil should be covered up and/or disposed of as soon as possible to
avoid being washed into the nearby receiving waters.
3.147
The
following mitigation measures are proposed to minimize the potential water
quality impacts from the marine piling works for construction of the temporary
jetty:
·
Silt
curtains should be installed around the working area as necessary to minimize
the release of sediment and construction wastes.
·
All
wastewater generated from the piling activities should be collected by a
derrick lighter or other collection system and be treated before controlled
discharge.
·
Spoil
should be collected by sealed hopper barges for proper disposal.
Regular Maintenance of Silt Screens
3.148 Silt screens are recommended to be deployed at the seawater intakes during the construction works period. Installation of silt screens at the seawater intake points may cause a potential for accumulation and trapping of pollutants, floating debris and refuse behind the silt screens and may lead to potential water quality deterioration at the seawater intake points. Major sources of pollutants and floating refuse include the runoff and storm water discharges from the nearby coastal areas. As a mitigation measure to avoid the pollutant and refuse entrapment problems and to ensure that the impact monitoring results are representative, regular maintenance of the silt screens and refuse collection should be performed at the monitoring stations at regular intervals on a daily basis. The Contractor should be responsible for keeping the water behind the silt screen free from floating rubbish and debris during the impact monitoring period.
Floating Refuse and Debris
3.149 Floating refuse and debris may arise from illegal dumping and littering from marine vessels and runoff from the coastal areas. It is recommended that collection and removal of floating refuse should be performed at regular intervals on a daily basis. The Contractor should be responsible for keeping the water within the site boundary and the neighbouring water free from rubbish during the dredging works.
Construction Site Run-off and General Construction Activities
3.150 The site practices outlined in ProPECC PN 1/94 “Construction Site Drainage” should be followed as far as practicable in order to minimise surface run-off and the chance of erosion. Effluent discharged from the construction site should comply with the standards stipulated in the TM-DSS. The following measures are recommended to protect water quality and sensitive uses of the coastal area, and when properly implemented should be sufficient to adequately control site discharges so as to avoid water quality impacts:
Surface Run-off
3.151 Surface run-off from
construction sites should be discharged into storm drains via adequately
designed sand/silt removal facilities such as sand traps, silt traps and
sedimentation basins. Channels or
earth bunds or sand bag barriers should be provided on site to properly direct stormwater to such silt removal facilities. Perimeter channels at site boundaries
should be provided where necessary to intercept storm run-off from outside the
site so that it will not wash across the site. Catchpits and
perimeter channels should be constructed in advance of site formation works and
earthworks.
3.152 Silt removal facilities should be maintained and the deposited silt and grit should be removed regularly, at the onset of and after each rainstorm to prevent local flooding. Minimum distances of 100 m should be maintained between the discharge points of construction site runoff and the existing saltwater intakes.
3.153 Construction works should be programmed to minimize soil excavation works in rainy seasons (April to September). If excavation in soil cannot be avoided in these months or at any time of year when rainstorms are likely, for the purpose of preventing soil erosion, temporary exposed slope surfaces should be covered e.g. by tarpaulin, and temporary access roads should be protected by crushed stone or gravel, as excavation proceeds. Intercepting channels should be provided (e.g. along the crest / edge of excavation) to prevent storm runoff from washing across exposed soil surfaces. Arrangements should always be in place in such a way that adequate surface protection measures can be safely carried out well before the arrival of a rainstorm.
3.155 Measures should be taken to minimize the ingress of rainwater into trenches. If excavation of trenches in wet seasons is necessary, they should be dug and backfilled in short sections. Rainwater pumped out from trenches or foundation excavations should be discharged into storm drains via silt removal facilities.
3.156 Open stockpiles of construction materials (e.g. aggregates, sand and fill material) on sites should be covered with tarpaulin or similar fabric during rainstorms.
Boring and Drilling Water
Wastewater from Mixing Trucks and Drum Mixers
3.159
Wastewater generated from the washing down of
mixing trucks and drum mixers and similar equipment should whenever practicable
be used for other site activities.
The discharge of wastewater should be kept to a minimum and should be
treated to meet the appropriate standard as specified in the TM-DSS before discharging.
3.160 To prevent pollution from wastewater overflow, the pump of any wastewater system should be provided with an on-line standby pump of adequate capacity and with automatic alternating devices.
3.161 Under normal circumstances, surplus wastewater may be discharged into foul sewers after treatment in silt removal and pH adjustment facilities (to within the pH range of 6 to 10). Disposal of wastewater into storm drains will require more elaborate treatment.
Bentonite Slurries
3.162
Bentonite slurries
used in diaphragm wall construction should be reconditioned and used again
wherever practicable. If the
disposal of a certain residual quantity cannot be avoided, the bentonite slurries should either be dewatered or mixed with
inert fill material for disposal to a public filling area.
3.163 If the used bentonite slurry is intended to be disposed of through the public drainage system, it should be treated to the respective effluent standards applicable to foul sewer, storm drains or the receiving waters as set out in the TM-DSS.
Water for Testing & Sterilization of Water Retaining Structures and Water Pipes
3.164
Water used in water testing to check leakage of
structures should be used for other purposes as far as practicable. Surplus unpolluted water will be
discharged into storm drains.
3.165 Sterilization is commonly accomplished by chlorination. Specific advice from EPD should be sought during the design stage of the works with regard to the disposal of the sterilizing water. The sterilizing water should be used again wherever practicable.
Acid Cleaning, Etching and Pickling Wastewater
3.166
Acidic wastewater generated from acid cleaning,
etching, pickling and similar activities should be neutralized to within the pH
range of 6 to 10 before discharging into foul sewers. If there is no public foul sewer in the
vicinity, the neutralized wastewater should be tankered
off site for disposal into foul sewers or treated to a standard acceptable to
storm drains and the receiving waters.
Wastewater from Site Facilities
3.167
Wastewater collected from any temporary canteen
kitchens, including that from basins, sinks and floor drains, should be
discharged into foul sewer via grease traps capable of providing at least 20
minutes retention during peak flow.
In case connection to the public foul sewer is not feasible, wastewater
generated from kitchens or canteen, if any, should be collected in a temporary
storage tank. A licensed waste
collector should be deployed to clean the temporary storage tank on a regular
basis.
3.168 Drainage serving any open oil filling point should be connected to storm drains via petrol interceptors with peak storm bypass.
Effluent Discharge
3.170 There is a need to apply to EPD for a discharge licence for discharge of effluent from the construction site under the WPCO. The discharge quality must meet the requirements specified in the discharge licence. All the runoff and wastewater generated from the works areas should be treated so that it satisfies all the standards listed in the TM-DSS. Minimum distances of 100 m should be maintained between the discharge points of construction site effluent and the existing seawater intakes. The beneficial uses of the treated effluent for other on-site activities such as dust suppression and general cleaning etc., can minimise water consumption and reduce the effluent discharge volume. If monitoring of the treated effluent quality from the works areas is required during the construction phase of the Project, the monitoring should be carried out in accordance with the WPCO license which is under the ambit of Regional Office (RO) of EPD.
Sewage from Construction Workforce
3.171 Construction work force sewage discharges on site are expected to be discharged to the nearby existing trunk sewer or sewage treatment facilities. If disposal of sewage to public sewerage system is not feasible, appropriate numbers of portable toilets shall be provided by a licensed contractor to serve the construction workers over the construction site to prevent direct disposal of sewage into the water environment. The Contractor shall also be responsible for waste disposal and maintenance practices.
Accidental Spillage of Chemicals
3.174 Any service shop and maintenance facilities should be located on hard standings within a bunded area, and sumps and oil interceptors should be provided. Maintenance of vehicles and equipment involving activities with potential for leakage and spillage should only be undertaken within the areas appropriately equipped to control these discharges.
3.175 Disposal of chemical wastes should be carried out in compliance with the Waste Disposal Ordinance. The “Code of Practice on the Packaging, Labelling and Storage of Chemical Wastes” published under the Waste Disposal Ordinance details the requirements to deal with chemical wastes. General requirements are given as follows:
Ÿ Suitable containers should be used to hold the chemical wastes to avoid leakage or spillage during storage, handling and transport.
Ÿ Chemical waste containers should be suitably labelled, to notify and warn the personnel who are handling the wastes, to avoid accidents.
Ÿ Storage area should be selected at a safe location on site and adequate space should be allocated to the storage area.
Evaluation of Residual Impacts
Marine Construction
3.176 The major water quality impact associated with marine construction activities is the elevation of SS within the marine water column. Provided that the recommended mitigation measures are properly implemented, there would be no unacceptable residual water quality impact due to the proposed construction works.
Land-based Construction
3.177
General construction activities associated with
the construction of the Project could lead to site runoff containing elevated
concentrations of SS and associated contaminants that may enter into the marine
water. However, it is anticipated
that the identified water quality impacts will generally be temporary and
localized during construction. No
unacceptable residual water quality impacts are anticipated during the
construction of the proposed infrastructure, provided all of the recommended mitigation
measures are properly implemented and all construction site / works area
discharges comply with the TM-DSS standards.
Environmental Monitoring and Audit
3.178 Based on the above assessment of the water quality impact, an environmental monitoring and audit (EM&A) programme is considered necessary to obtain a database of baseline information of water quality before the marine construction works, and thereafter, to monitor any variation of water quality from the baseline conditions and exceedances of WQOs at sensitive receivers during the marine construction works. DO, turbidity and SS levels should be monitored at designated marine water quality monitoring stations in CBTS before, during and after the construction phase. The DO levels in the CBTS should also be monitored during the construction works for PW1.1 to 1.4 to avoid aggravation of odour nuisance from seawater arising from temporary reclamation. Details of the EM&A programme will be provided in a stand-alone EM&A Manual. If the monitoring data indicate that the proposed construction works result in unacceptable impacts, appropriate actions should be taken to review the construction method and additional measures such as slowing down, or rescheduling of works should be implemented as necessary. In case the temporary reclamation work is found during the water quality monitoring and audit programme to cause unacceptable oxygen depletion (e.g. <2 mg/L) in the CBTS, further water quality improvement measures (e.g. use of aeration method to improve the DO levels in the marine embayment) should be considered and implemented in the CBTS as necessary to rectify the problems.
Conclusion
Construction Phase
Marine Construction
3.179
The water quality impacts during the marine
construction works have been quantitatively assessed by numerical modelling.
Suspended solids are identified as the most significant water quality
parameter during the marine construction works. The worst-case scenario during the
marine construction period, taking into account the cumulative effects from
other concurrent marine works has been
assessed. It is predicted that,
with the implementation of the recommended mitigation measures, there would be
no unacceptable water quality impacts due to the construction of the SCL
Protection Works and due to the cumulative effects from other concurrent marine construction activities. A water quality monitoring
and audit programme will be implemented to ensure the
effectiveness of the proposed
water quality mitigation measures.
Land-based Construction
3.180
The
key issue from the land-based construction
activities would be the potential water quality impact due to the release of
sediment-laden water from surface works areas and discharge of construction
site effluent. Minimisation
of water quality deterioration could be achieved through implementing adequate
mitigation measures. Regular site inspections should be
undertaken routinely to inspect the construction activities and works areas in
order to ensure the recommended mitigation measures are properly implemented.
[5] Mott MacDonald (1991). Contaminated Spoil Management Study, Final Report, Volume 1, for EPD, October 1991.