5.1.1.1
This Section presents an evaluation and assessment of the potential
water quality impacts from the construction and operation of the Project in accordance
with Clause 3.4.6 of the EIA Study Brief,
and the results were assessed with reference to the relevant environmental legislation,
standards and criteria.
5.2.1
General
5.2.1.1
The following legislation and relevant guidance or non-statutory
guidelines are applicable to the evaluation of water quality impacts associated
with the construction and operation of the Project.
5.2.2
Water Pollution
Control Ordinance (WPCO) (Cap 358)
5.2.2.1
The Water Pollution Control Ordinance
(WPCO) (Cap 358) is the primary legislation for the control of water pollution
and water quality in Hong Kong. Under
the WPCO, Hong Kong waters are divided into 10 Water Control Zones (WCZs). Each WCZ has a designated set of statutory
Water Quality Objectives (WQOs).
5.2.2.2
The proposed Project elements span from Tung Chung to the east side of the Airport Island
and the west side of the Hong Kong Port (HKP). According to Clause 3.4.6.2 of the EIA Study Brief, the Assessment Area shall include
areas within 500 m from the boundary of the Project and shall cover the North Western Water Control Zone (NWWCZ) under the WPCO. The applicable WQOs for
NWWCZ are presented in Table 5.1.
Table 5.1 Summary
of Water Quality Objectives for NWWCZ
|
|
Water
Quality Objectives
|
Sub-Zone
|
|
A
|
AESTHETIC APPEARANCE
|
|
|
a)
|
Waste discharges shall cause no objectionable odours or discolouration
of the water.
|
Whole zone
|
|
b)
|
Tarry residues, floating wood, articles made of glass, plastic, rubber
or of any other substances should be absent.
|
Whole zone
|
|
c)
|
Mineral oil should not be visible on the surface. Surfactants should not give rise to a lasting
foam.
|
Whole zone
|
|
d)
|
There should be no recognisable sewage derived debris.
|
Whole zone
|
|
e)
|
Floating, submerged and semi-submerged objects of a size likely to
interfere with the free movement of vessels, or cause damage to vessels, should
be absent.
|
Whole zone
|
|
f)
|
Waste discharges shall not cause the water to contain substances
which settle to form objectionable deposits.
|
Whole zone
|
|
B
|
BACTERIA
|
|
|
a)
|
The level of Escherichia coli should not exceed 610 per 100 mL, calculated
as the geometric mean of all samples collected in a calendar year.
|
Secondary Contact Recreation Subzones
|
|
b)
|
The level of Escherichia coli should be less than 1 per
100mL, calculated as the running median of the most recent 5 consecutive samples
taken at intervals of between 7 and 21 days.
|
Tuen Mun (A) and
Tuen Mun (B) Subzones and Water Gathering Ground Subzones
|
|
c)
|
The level of Escherichia coli should not exceed 1 000 per 100 mL,
calculated as the running median of the most recent 5 consecutive samples taken
at intervals of between 7 and 21 days.
|
Tuen
Mun (C) Subzone and other inland waters
|
|
d)
|
The level of Escherichia coli should not exceed 180 per 100 mL, calculated
as the geometric mean of all samples collected from March to October inclusive. Samples should be taken at least 3 times
in one calendar month at intervals of between 3 and 14 days.
|
Bathing Beach Subzones
|
|
C
|
COLOUR
|
|
|
a)
|
Waste discharges shall not cause the colour of water to exceed 30
Hazen units.
|
Tuen
Mun (A) and Tuen Mun (B) Subzones and Water Gathering
Ground Subzones
|
|
b)
|
Waste discharges shall not cause the colour of water to exceed 50
Hazen units.
|
Tuen
Mun (C) Subzone and other inland waters
|
|
D
|
DISSOLVED OXYGEN
|
|
|
a)
|
Waste discharges shall not cause the level of dissolved oxygen to
fall below 4 mg per litre for 90% of the sampling occasions during the whole year;
values should be calculated as water column average (arithmetic mean of at least
3 measurements at 1 m below surface, mid-depth and 1 m above seabed). In addition, the concentration of dissolved
oxygen should not be less than 2 mg per litre within 2 m of the seabed for 90%
of the sampling occasions during the whole year.
|
Marine waters
|
|
b)
|
Waste discharges shall not cause the level of dissolved oxygen to
be less than 4 mg per litre.
|
Tuen
Mun (A), Tuen Mun (B) and Tuen
Mun (C) Subzones, Water Gathering Ground Subzones and other inland waters
|
|
E
|
pH
|
|
|
a)
|
The pH of the water should be within the range of 6.5-8.5 units. In addition, waste discharges shall not
cause the natural pH range to be extended by more than 0.2 unit.
|
Marine waters excepting Bathing Beach Subzones
|
|
b)
|
Waste discharges shall not cause the pH of the water to exceed the
range of 6.5-8.5 units.
|
Tuen
Mun (A), Tuen Mun (B) and Tuen
Mun (C) Subzones and Water Gathering Ground Subzones
|
|
c)
|
The pH of the water should be within the range of 6.0-9.0 units.
|
Other inland waters
|
|
d)
|
The pH of the water should be within the range of 6.0-9.0 units for
95% of samples collected during the whole year. In addition, waste discharges shall not
cause the natural pH range to be extended by more than 0.5 unit.
|
Bathing Beach Subzones
|
|
F
|
TEMPERATURE
|
|
|
a)
|
Waste discharges
shall not cause the natural daily temperature range to change by more than 2.0��C.
|
Whole zone
|
|
G
|
SALINITY
|
|
|
a)
|
Waste discharges
shall not cause the natural ambient salinity level to change by more than 10%.
|
Whole zone
|
|
H
|
SUSPENDED SOLIDS
|
|
|
a)
|
Waste discharges shall neither cause the natural ambient level to
be raised by more than 30% nor give rise to accumulation of suspended solids which
may adversely affect aquatic communities.
|
Marine waters
|
|
b)
|
Waste discharges shall not cause the annual median of suspended solids
to exceed 20 mg per litre.
|
Tuen
Mun (A), Tuen Mun (B) and Tuen
Mun (C) Subzones and Water Gathering Ground Subzones
|
|
c)
|
Waste discharges shall not cause the annual median of suspended solids
to exceed 25 mg per litre.
|
Other inland waters
|
|
I
|
AMMONIA
|
|
|
a)
|
The unionized
ammoniacal nitrogen level should not be more than 0.021 mg per litre, calculated
as the annual average (arithmetic mean).
|
Whole zone
|
|
J
|
NUTRIENTS
|
|
|
a)
|
Nutrients shall not be present in quantities sufficient to cause
excessive or nuisance growth of algae or other aquatic plants.
|
Marine waters
|
|
b)
|
Without limiting the generality of objective (a) above, the level
of inorganic nitrogen should not exceed 0.3 mg per litre, expressed as annual
water column average (arithmetic mean of at least 3 measurements at 1 m below
surface, mid-depth and 1 m above seabed).
|
Castle Peak Bay Subzone
|
|
c)
|
Without limiting the generality of objective (a) above, the level
of inorganic nitrogen should not exceed 0.5 mg per litre, expressed as annual
water column average (arithmetic mean of at least 3 measurements at 1 m below
surface, mid-depth and 1 m above seabed).
|
Marine waters excepting Castle Peak Bay Subzone
|
|
K
|
5-DAY BIOCHEMICAL OXYGEN DEMAND
|
|
|
a)
|
Waste discharges shall not cause the 5-day biochemical oxygen demand
to exceed 3 mg per litre.
|
Tuen
Mun (A), Tuen Mun (B) and Tuen
Mun (C) Subzones and Water Gathering Ground Subzones
|
|
b)
|
Waste discharges shall not cause the 5-day biochemical oxygen demand
to exceed 5 mg per litre.
|
Other inland waters
|
|
L
|
CHEMICAL OXYGEN DEMAND
|
|
|
a)
|
Waste discharges shall not cause the chemical oxygen demand to exceed
15 mg per litre.
|
Tuen
Mun (A), Tuen Mun (B) and Tuen
Mun (C) Subzones and Water Gathering Ground Subzones
|
|
b)
|
Waste discharges shall not cause the chemical oxygen demand to exceed
30 mg per litre.
|
Other inland waters
|
|
M
|
TOXINS
|
|
|
a)
|
Waste discharges shall not cause the toxins in water to attain such
levels as to produce significant toxic, carcinogenic, mutagenic or teratogenic
effects in humans, fish or any other aquatic organisms, with due regard to biologically
cumulative effects in food chains and to toxicant interactions with each other.
|
Whole zone
|
|
b)
|
Waste discharges shall not cause a risk to any beneficial use of
the aquatic environment.
|
Whole zone
|
|
N
|
PHENOL
|
|
|
a)
|
Phenols shall not be present in such
quantities as to produce a specific odour, or in concentration greater than 0.05
mg per litre as C6H5OH.
|
Bathing Beach Subzones
|
|
O
|
TURBIDITY
|
|
|
a)
|
Waste discharges shall not reduce light transmission substantially
from the normal level.
|
Bathing Beach Subzones
|
5.2.3
Technical Memorandum
for Effluents Discharged into Drainage and Sewerage Systems, Inland and Coastal
Waters (TM-ICW)
5.2.3.1 All discharges from the construction and operational phases of the proposed
Project are required to comply with the Technical
Memorandum Standards for Effluents Discharged into Drainage and Sewerage Systems,
Inland and Coastal Waters (TM-ICW) issued under Section 21 of the WPCO.
5.2.3.2 The TM-ICW defines acceptable discharge
limits to different types of receiving waters. Under the TM-ICW, effluents discharged into the drainage and sewerage systems,
inshore and coastal waters of the WCZs are subject to pollutant concentration standards
for specified discharge volumes. These
are defined by the Environmental Protection Department (EPD) and are specified in
licence conditions for any new discharge(s) within a WCZ.
5.2.4
Technical Memorandum
on Environmental Impact Assessment Process (EIAO-TM)
5.2.4.1 Annexes 6 and 14 of the EIAO-TM provide general guidelines and criteria to be used in assessing
water quality impacts.
5.2.4.2 The EIAO-TM recognizes that, in
the application of the above water quality criteria, it may not be possible to achieve
the WQO at the point of discharge as there are areas which are subjected to greater
impacts (which are termed by the EPD as the mixing zones), where the initial dilution
of the discharge takes place. The definition
of this area is determined on a case-by-case basis. In general, the criteria for acceptance of
the mixing zones are that it must not impair the integrity of the water body as
a whole and must not damage the ecosystem.
5.2.5
Practice Note
for Professional Persons, Construction Site Drainage
5.2.5.1
Apart from the above statutory requirements,
the Practice Note for Professional Persons,
Construction Site Drainage (ProPECC PN 1/94), issued
by EPD in 1994, also provide useful guidelines on the prevention of water pollution
associated with construction activities.
5.3
Baseline Conditions
5.3.1
Assessment Area
5.3.1.1 According to Clause 3.4.6.2 of
the EIA Study Brief, the Assessment Area shall include areas within 500 m from the
boundary of the Project and shall cover the NWWCZ as designated
under the WPCO and the water sensitive receivers in the vicinity of the Project.
5.3.2
Marine Water Quality
5.3.2.1 Baseline marine water quality of the Assessment Area has been determined
through a review of EPD routine water quality monitoring data collected between
2017 and 2021. This dataset provides
Hong Kong��s most comprehensive long-term water quality monitoring data and allows
an indication of temporal and spatial change in marine water quality in Hong Kong. Water quality monitoring data from EPD monitoring
stations that are located within or close to the Assessment Area were used to provide
the baseline water quality conditions of the Assessment Area. The monitoring results from 2017 to 2021
at the selected monitoring stations are summarized in Table 5.2.
Locations of the selected marine water quality monitoring stations are presented
in
Figure 5.1.
5.3.2.2 Compliance with the WQOs is generally observed in most parameters at the
selected monitoring stations, except for total inorganic nitrogen (TIN) levels at
NM3, NM5 and NM6. According to
EPD's Marine Water Quality in Hong Kong in 2021, the overall WQO
compliance rate of the North Western WCZ was 89%, with the DO and unionized
ammonia nitrogen WQOs fully met. Under
the influence of high background level in the Pearl River Estuary, the
compliance rate for TIN WQO was 67%.
Table 5.2 Summary
of EPD Routine Water Quality Monitoring Data from Selected Stations within the
Assessment Area (2017 �C 2021)
|
Parameter
|
NM1
|
NM2
|
NM3
|
NM5
|
NM6
|
NM8
|
|
Temperature (��C)
|
24.3
|
24.6
|
24.3
|
24.6
|
24.9
|
24.7
|
|
(16.6-30.8)
|
(16.7-31.7)
|
(16.9-31.5)
|
(16.9-31.5)
|
(16.6-32.1)
|
(16.4-32.2)
|
|
Salinity (psu)
|
29.7
|
28.0
|
28.0
|
27.0
|
25.2
|
27.2
|
|
(22.1-33.5)
|
(18.1-33.4)
|
(19.5-33.4)
|
(19.6-33.3)
|
(9.8-33.2)
|
(11.4-33.7)
|
|
Dissolved Oxygen
(mg L-1)
|
5.5
|
5.6
|
5.7
|
5.6
|
6.0
|
6.1
|
|
(3.5-7.9)
|
(4.1-7.9)
|
(4.0-8.3)
|
(3.5-8.0)
|
(4.2-8.5)
|
(4.2-8.8)
|
|
Dissolved Oxygen
(mg L-1) - Bottom
|
5.1
|
5.5
|
5.4
|
5.3
|
6.0
|
5.8
|
|
(1.8-7.7)
|
(2.5-7.7)
|
(2.2-8.2)
|
(1.8-7.9)
|
(3.9-8.8)
|
(2.8-8.6)
|
|
Suspended Solids (mg L-1)
|
9.4
|
8.6
|
9.5
|
11.5
|
11.1
|
14.4
|
|
(1.6-38.7)
|
(1.6-35.7)
|
(1.5-37.3)
|
(2.2-42.3)
|
(2.3-45.3)
|
(2.2-48.7)
|
|
5-day Biochemical
Oxygen Demand (mg L-1)
|
0.7
|
0.8
|
0.7
|
0.7
|
0.9
|
0.8
|
|
(0.1-2.8)
|
(0.1-4.9)
|
(0.2-2.8)
|
(0.2-2.6)
|
(0.2-6.4)
|
(0.2-2.7)
|
|
Unionized Ammonia Nitrogen
(mg L-1)
|
0.003
|
0.003
|
0.003
|
0.003
|
0.004
|
0.002
|
|
(0.001-0.013)
|
(0.000-0.009)
|
(0.000-0.013)
|
(0.000-0.012)
|
(0.000-0.043)
|
(0.000-0.008)
|
|
Total Inorganic Nitrogen
(mg L-1)
|
0.41
|
0.49
|
0.52
|
0.62
|
0.69
|
0.48
|
|
(0.15-0.80)
|
(0.13-1.33)
|
(0.14-1.02)
|
(0.17-1.22)
|
(0.12-1.82)
|
(0.08-1.63)
|
|
Orthophosphate
Phosphorus (mg L-1)
|
0.019
|
0.019
|
0.019
|
0.022
|
0.021
|
0.014
|
|
(0.007-0.033)
|
(0.003-0.040)
|
(0.003-0.039)
|
(0.003-0.041)
|
(0.003-0.042)
|
(0.003-0.039)
|
|
Total Phosphorus (mg L-1)
|
0.05
|
0.05
|
0.05
|
0.06
|
0.05
|
0.05
|
|
(0.03-0.15)
|
(0.02-0.24)
|
(0.03-0.14)
|
(0.02-0.17)
|
(0.02-0.12)
|
(0.02-0.22)
|
|
Chlorophyll-a (µg L-1)
|
3.1
|
3.6
|
3.3
|
3.1
|
4.5
|
4.5
|
|
(0.5-16.3)
|
(0.4-22.3)
|
(0.4-17.7)
|
(0.4-14.6)
|
(0.5-26.7)
|
(0.7-19.2)
|
|
Escherichia coli
(cfu/100ml)
|
142
|
55
|
97
|
225
|
39
|
5
|
|
(6-2433)
|
(3-1225)
|
(5-4367)
|
(6-4320)
|
(1-637)
|
(1-300)
|
Notes:
1. Data
presented are depth-averaged values calculated by taking the means of three depths,
i.e. surface (S), mid-depth (M) and bottom (B), except as specified.
2. Data
presented are annual arithmetic means except for E. coli, which are geometric
means.
3. Shaded
cells indicate non-compliance with the WQOs.
5.3.2.3 In addition, review of water quality impact monitoring data from Three-Runway
System (AEIAR-185/2014) (referred as 3RS hereafter) between 2016 and 2022 was
undertaken. With reference to 3RS��s
project webpage (),
water quality monitoring data at three control stations C1, C2 and C3 as shown
in Figure 5.1 were selected
to compare the nearest EPD routine water quality monitoring stations NM8, NM5
and NM2, respectively. Parameters
available on 3RS project webpage for comparison include salinity, temperature,
pH, DO, turbidity and SS. 3RS
impact water quality monitoring data is summarized in Table 5.3.
Table 5.3 Summary
of 3RS Water Quality Monitoring Data from 2016-2022
|
Parameter
|
C3
|
C2
|
C1
|
|
Temperature (��C)
|
23.9
|
24.1
|
23.9
|
|
(12.4-31)
|
(14-31.5)
|
(13.3-30.8)
|
|
Salinity (psu)
|
28.2
|
25.9
|
28
|
|
(6.4-34.9)
|
(1.1-34.5)
|
(3.4-35.8)
|
|
pH
|
8.03
|
8.00
|
8.06
|
|
(3.80-8.50)
|
(3.83-10.90)
|
(3.00-8.00)
|
|
Dissolved Oxygen
(mg L-1)
|
6.4
|
6.4
|
6.7
|
|
(2.3-12.8)
|
(2.3-12.8)
|
(1.7-13.1)
|
|
Dissolved Oxygen
(mg L-1) - Bottom
|
6.2
|
6.2
|
6.4
|
|
(2.3-10)
|
(2.3-10.1)
|
(1.7-10.8)
|
|
Suspended Solids (mg L-1)
|
6.2
|
6.9
|
8.5
|
|
(2-49)
|
(2-60)
|
(2-922)
|
|
Turbidity (NTU)
|
5.9
|
8.2
|
9.4
|
|
(3.8-8.5)
|
(3.8-10.9)
|
(3.0-8.0)
|
Notes:
1. Data
presented are depth-averaged values calculated by taking the means of three
depths, i.e. surface (S), mid-depth (M) and bottom (B), except as specified.
5.3.3
Marine Sediment
Quality
5.3.3.1
Baseline marine sediment quality in the Assessment
Area has been determined through a review of EPD routine sediment quality monitoring
data collected between 2017 and 2021.
Sediment monitoring data from relevant EPD monitoring stations were used
to represent the sediment quality adjacent to the Project (Table 5.4). Locations of selected
sediment quality monitoring stations are presented in Figure 5.1.
5.3.3.2
Sediment quality
monitoring data from the EPD monitoring stations were compared with the relevant
sediment quality criteria specified in ADV-21
Management Framework for Disposal of Dredged/Excavated Sediment. The EPD routine sediment quality monitoring
data indicate that the contaminant levels in the sediments within the NWWCZ are below Lower Chemical
Exceedance Level (LCEL) except for arsenic. Minor exceedance in LCEL for arsenic was
recorded at NS3 and NS6.
Table 5.4 Summary
of EPD Routine Sediment Quality Monitoring Data from Selected Stations within
the Assessment Area (2017�C 2021)
|
Parameter
|
ADV-21 Guideline
|
NS2
|
NS3
|
NS4
|
NS6
|
|
LCEL
|
UCEL
|
|
Arsenic (mg kg-1)
|
12
|
42
|
12.0
|
12.8
|
11.1
|
16.1
|
|
(7.7-23.0)
|
(9.7-15.0)
|
(8.3-15.0)
|
(13.0-22.0)
|
|
Cadmium (mg kg-1)
|
1.5
|
4
|
<0.1
|
<0.1
|
<0.1
|
<0.1
|
|
(<0.1-0.1)
|
(<0.1-<0.1)
|
(<0.1-<0.1)
|
(<0.1-0.1)
|
|
Chromium (mg kg-1)
|
80
|
160
|
34.3
|
31.4
|
25.0
|
34.2
|
|
(21.0-53.0)
|
(22.0-47.0)
|
(17.0-44.0)
|
(22.0-49.0)
|
|
Copper (mg kg-1)
|
65
|
110
|
32.5
|
28.3
|
25.6
|
27.7
|
|
(17.0-48.0)
|
(17.0-37.0)
|
(16.0-44.0)
|
(15.0-39.0)
|
|
Lead (mg kg-1)
|
75
|
110
|
45.5
|
39.3
|
33.9
|
43.2
|
|
(29.0-90.0)
|
(33.0-48.0)
|
(25.0-41.0)
|
(34.0-52.0)
|
|
Mercury (mg kg-1)
|
0.5
|
1
|
0.10
|
0.10
|
0.12
|
0.11
|
|
(0.06-0.14)
|
(0.06-0.12)
|
(0.06-0.54)
|
(0.06-0.17)
|
|
Nickel (mg kg-1)
|
40
|
40
|
20.4
|
19.0
|
15.9
|
21.5
|
|
(13.0-31.0)
|
(13.0-27.0)
|
(10.0-26.0)
|
(15.0-27.0)
|
|
Silver (mg kg-1)
|
1
|
2
|
<0.2
|
<0.2
|
<0.2
|
<0.2
|
|
(<0.2-<0.2)
|
(<0.2-<0.2)
|
(<0.2-<0.2)
|
(<0.2-<0.2)
|
|
Zinc (mg kg-1)
|
200
|
270
|
152.9
|
117.2
|
116.7
|
117.2
|
|
(79.0-220.0)
|
(92.0-160.0)
|
(78.0-200.0)
|
(82.0-180.0)
|
|
Total Polychlorinated Biphenyls (PCBs) (��g kg-1)
|
23
|
180
|
18
|
18
|
18
|
18
|
|
(18-18)
|
(18-18)
|
(18-18)
|
(18-18)
|
|
Low Molecular Weight Polycyclic Aromatic
Hydrocarbons (PAHs) (��g kg-1)
|
550
|
3,160
|
<180
|
<180
|
<180
|
<180
|
|
(<180-<180)
|
(<180-224)
|
(<180-<180)
|
(<180-200)
|
|
High Molecular Weight Polycyclic
Aromatic Hydrocarbons (PAHs) (��g kg-1)z
|
1,700
|
9,600
|
69
|
96
|
73
|
50
|
|
(41-110)
|
(<32-200)
|
(<32-225)
|
(<32-92)
|
|
Chemical Oxygen Demand (mg kg-1)
|
--
|
--
|
11520
|
13570
|
13080
|
11780
|
|
(9200-13000)
|
(6700-17000)
|
(8800-17000)
|
(9800-15000)
|
|
Total Kjeldahl
Nitrogen (mg kg-1)
|
--
|
--
|
442.5
|
450.0
|
448.8
|
433.8
|
|
(280.0-540.0)
|
(380.0-530.0)
|
(330.0-740.0)
|
(340.0-570.0)
|
Notes:
1. Data
presented are arithmetic means average the years.
2. Underlined
values are above the LCEL. Bold values
are above the UCEL.
5.3.4
Sediment Quality
in Project Area
5.3.4.1
Sediment sampling was collected at five sampling
locations in vicinity of the project area where marine works is needed between 1
June 2022 and 21 June 2022 to determine the levels of contaminants in the sediment. The collected sediment samples were delivered
to a laboratory and sediment elutriate test was undertaken to determine the potential
of release of sediment-bounded contaminants into the water column upon agitation
during maintenance dredging. For each
collected sediment sample, in-situ marine waters were mixed in a sediment-to-water
ratio of 1:4 on a volume basis. The
sediment quality results are detailed in Appendix 5.7.
A summary of sediment contaminant levels
under elutriate test is provided in Table 5.5.
Results indicated the release of contaminants from sediment was below levels
of reporting for all metals and organic pollutants except for arsenic and nickel.
Table 5.5 Summary
of Elutriate Test Results for Sediment Collected under this EIA
|
Boreholes
|
BHE1
|
BHE2
|
BHE3
|
BHE4
|
BHD4
|
|
|
Parameters
(Unit µg L-1 unless otherwise specified)
|
Concentration
in Seawater Blank
|
Concentration in Elutriate
|
Concentration Increase from Elutriation
|
Concentration
in Seawater Blank
|
Concentration in Elutriate
|
Concentration Increase from Elutriation
|
Concentration
in Seawater Blank
|
Concentration in Elutriate
|
Concentration Increase from Elutriation
|
Concentration
in Seawater Blank
|
Concentration in Elutriate
|
Concentration Increase from Elutriation
|
Concentration
in Seawater Blank
|
Concentration in Elutriate
|
Concentration Increase from Elutriation
|
Max. Concentration Increase from
Elutriation
|
|
(a)
|
(b)
|
(b)-(a)
|
(c)
|
(d)
|
(d)-(c)
|
(e)
|
(f)
|
(f)-(e)
|
(g)
|
(h)
|
(h)-(g)
|
(i)
|
(j)
|
(j)-(i)
|
|
Mercury
|
<0.05
|
<0.05
|
<0.01
|
<0.05
|
<0.05
|
<0.01
|
<0.05
|
<0.05
|
<0.01
|
<0.05
|
<0.05
|
<0.01
|
<0.05
|
<0.05
|
<0.01
|
<0.01
|
|
Arsenic
|
2
|
36
|
34
|
2
|
25
|
23
|
2
|
31
|
29
|
2
|
52
|
50
|
2
|
7
|
5
|
50
|
|
Cadmium
|
<0.1
|
<0.1
|
<0.1
|
<0.1
|
<0.1
|
<0.1
|
<0.1
|
<0.1
|
<0.1
|
<0.1
|
<0.1
|
<0.1
|
<0.1
|
<0.1
|
<0.1
|
<0.1
|
|
Chromium
|
<1.0
|
<1.0
|
<0.1
|
<1.0
|
<1.0
|
<0.1
|
<1.0
|
<1.0
|
<0.1
|
<1.0
|
<1.0
|
<0.1
|
<1.0
|
<1.0
|
<0.1
|
<0.1
|
|
Copper
|
1.2
|
<1.0
|
<0.1
|
3.0
|
<1.0
|
<0.1
|
1.3
|
1.3
|
<0.1
|
2.0
|
<1.0
|
<0.1
|
1.3
|
<1.0
|
<0.1
|
<0.1
|
|
Lead
|
<1.0
|
<1.0
|
<0.1
|
<1.0
|
<1.0
|
<0.1
|
<1.0
|
<1.0
|
<0.1
|
<1.0
|
<1.0
|
<0.1
|
<1.0
|
<1.0
|
<0.1
|
<0.1
|
|
Nickel
|
1.1
|
<1.0
|
<0.1
|
1.4
|
1.1
|
<0.1
|
1.0
|
1.2
|
0.2
|
1.2
|
<1.0
|
<0.1
|
1.3
|
<1.0
|
<0.1
|
0.2
|
|
Silver
|
<1.0
|
<1.0
|
<0.1
|
<1.0
|
<1.0
|
<0.1
|
<1.0
|
<1.0
|
<0.1
|
<1.0
|
<1.0
|
<0.1
|
<1.0
|
<1.0
|
<0.1
|
<0.1
|
|
Zinc
|
<10
|
<10
|
<1
|
<10
|
<10
|
<1
|
<10
|
<10
|
<1
|
<10
|
<10
|
<1
|
<10
|
<10
|
<1
|
<1
|
|
Total PCB
|
<0.01
|
<0.01
|
<0.01
|
<0.01
|
<0.01
|
<0.01
|
<0.01
|
<0.01
|
<0.01
|
<0.01
|
<0.01
|
<0.01
|
<0.01
|
<0.01
|
<0.01
|
<0.01
|
|
PAHs
|
<1.60
|
<1.60
|
<0.01
|
<1.60
|
<1.60
|
<0.01
|
<1.60
|
<1.60
|
<0.01
|
<1.60
|
<1.60
|
<0.01
|
<1.60
|
<1.60
|
<0.01
|
<0.01
|
|
TBT
|
<0.015
|
<0.015
|
<0.001
|
<0.015
|
<0.015
|
<0.001
|
<0.015
|
<0.015
|
<0.001
|
<0.015
|
<0.015
|
<0.001
|
<0.015
|
<0.015
|
<0.001
|
<0.001
|
|
Ammonia-N
(mg/L)
|
0.06
|
9.05
|
8.99
|
0.03
|
9.17
|
9.14
|
0.05
|
7.76
|
7.71
|
0.07
|
6.63
|
6.56
|
<0.01
|
0.64
|
0.64
|
9.14
|
|
Nitrite-N
(mg/L)
|
0.08
|
0.07
|
N/A
|
0.02
|
0.03
|
0.01
|
0.05
|
0.05
|
0.00
|
0.01
|
0.02
|
0.01
|
0.09
|
0.08
|
N/A
|
0.01
|
|
Total Kjeldahl Nitrogen (mg/L)
|
0.4
|
10.3
|
9.9
|
0.3
|
9.8
|
9.5
|
0.4
|
16.1
|
15.7
|
0.3
|
13.2
|
12.9
|
0.4
|
1.2
|
0.8
|
15.7
|
Note:
Please refer to Figure 6.1 of Chapter
6 for the locations of sediment sampling and Appendix
5.7 for the detailed results of the
elutriate test.
5.3.5
Water Sensitive
Receivers
5.3.5.1
The sensitive receivers that may be affected
by changes in water quality arising from the Project are identified in accordance
with the EIAO-TM and with reference to current land uses and relevant
published plans (e.g. relevant Outline Zoning Plans, Development Permission Area
Plans, Outline Development Plans and Layout Plans). For each of the sensitive receivers, established
threshold criteria or guidelines have been utilized for establishing the significance
of impacts to water quality.
5.3.5.2
Water Sensitive Receivers (WSRs) in the vicinity of the
project elements are identified as below, including coral communities, gazetted and non-gazetted bathing
beaches, seawater intakes, typhoon shelter, fish spawning grounds, dolphin habitats,
corals / artificial reef, sites of special scientific interest (SSSIs), horseshoe
crab habitats, mangrove stands and existing / planned / potential marine park. For consistencies, all WSRs within the NWWCZ
identified in the approved EIA of the Expansion of Hong Kong International Airport
into a Three-Runway System (AEIAR-185/2014) (referred as 3RS hereafter) are taken into account in this EIA.
In addition, a number of artificial reefs locations north to the embayment
area are also identified as WSRs for this EIA. The locations of the identified WSRs are listed in Table 5.6 and shown in Figure 5.1.
Table 5.6 Water
Sensitive Receivers
|
Description
|
Location
|
Model
Output Location
|
Geodesic
Distance from the
Area of Marine Facilities (km)
|
Geodesic
Distance from the
Area of Marine Viaduct (km)
|
|
Fisheries
Sensitive Receivers
|
|
Spawning Grounds
for commercial fisheries resources
|
North Lantau
|
F1
|
0.6
|
3.1
|
|
Marine
Ecological Sensitive Receivers
|
|
Marine Park
|
Sha Chau and Lung Kwu Chau Marine Park
|
E1
|
7.9
|
9.2
|
|
Marine Park
|
The Brothers Marine Park
|
E2
|
3.9
|
6.4
|
|
SSSI
|
Tai Ho Bay and Tai Ho Stream SSSI
|
E4
|
3.8
|
4.2
|
|
SSSI
|
Tung Chung Bay and San Tau Beach SSSI
|
E5
|
3.6
|
1.2
|
|
Horseshoe Crab
Habitat
|
Hau Hok Wan
|
E6
|
4.1
|
2.7
|
|
Horseshoe Crab
Habitat
|
Sha Lo Wan
|
E7
|
5.0
|
3.7
|
|
Horseshoe Crab
Habitat, Mangrove Stand
|
Sham Wat Wan
|
E8
|
7.5
|
5.7
|
|
Horseshoe Crab
Habitat, Mangrove Stand
|
Yam O Wan
|
E9
|
7.7
|
9.3
|
|
Artificial Reef
and coral communities
|
Sha Chau and Lung Kwu Chau Marine Park
|
CR1
|
7.1
|
8.0
|
|
Coral communities
|
The Brothers Islands (West Brother)
|
CR2
|
2.3
|
5.0
|
|
Coral communities
|
North of Sheung Sha Chau
|
CR3
|
7.4
|
8.6
|
|
Coral communities
|
Sham Shui Kok (2)
|
CR4
|
3.7
|
5.0
|
|
Artificial Reef
|
HKIA Approach Area
|
CLK1
|
1.5
|
4.1
|
|
Artificial Reef
|
HKIA Approach Area
|
CLK2
|
1.2
|
3.9
|
|
Artificial Reef
|
HKIA Approach Area
|
CLK3
|
1.0
|
3.6
|
|
Artificial Reef
|
HKIA Approach Area
|
CLK4
|
1.0
|
3.6
|
|
Artificial Reef
|
HKIA Approach Area
|
CLK5
|
1.2
|
3.9
|
|
Water
Sensitive Receivers
|
|
Non-gazetted
beach
|
Lung Kwu Sheung Tan
|
B1
|
9.9
|
12.3
|
|
Non-gazetted
beach
|
Lung Tsai / Lung Kwu Tan
|
B2
|
8.1
|
10.5
|
|
Gazetted Beach
|
Butterfly Beach
|
B3
|
6.4
|
9.1
|
|
Gazetted Beach
|
Cafeteria New Beach
|
B4
|
7.5
|
10.2
|
|
Gazetted Beach
|
Golden Beach
|
B5
|
7.4
|
10.1
|
|
Gazetted Beach
|
Castle Peak Beach
|
B6
|
7.8
|
10.5
|
|
Gazetted Beach
|
Kadoorie Beach
|
B7
|
7.6
|
10.3
|
|
Gazetted Beach
|
Cafeteria Old Beach
|
B8
|
7.6
|
10.3
|
|
Seawater Intake
|
Castle Peak Power Station Cooling Water Intake
|
C1
|
6.8
|
9.1
|
|
Seawater Intake
|
Cooling Water Intake for Shiu
Wing Steel Mills
|
C2
|
5.8
|
8.1
|
|
Seawater Intake
|
WSD Seawater Intake at Tuen
Mun
|
C3
|
6.5
|
9.2
|
|
Seawater Intake
|
Proposed Lok On Pai Intake (Pumping Station)
|
C4
|
7.3
|
9.9
|
|
Seawater Intake
|
Future Seawater Intake Point for Sunny Bay
|
C5
|
8.7
|
10.6
|
|
Seawater Intake
|
Proposed Ta Pang Po Intake (Pumping Station)
|
C6
|
6.4
|
8.1
|
|
Seawater Intake
|
Future Seawater Intake Point for Tung Chung East
|
C8
|
1.5
|
2.0
|
|
Seawater Intake
|
Hong Kong Port (HKP) Intake
|
C9
|
0.5
|
3.2
|
|
Seawater Intake
|
Cooling Water Intake at Hong Kong International Airport
(HKIA) North
|
C10
|
1.0
|
3.2
|
|
Seawater Intake
|
Future Seawater Intake at HKIA East
|
C11
|
2.4
|
4.1
|
|
Seawater Intake
|
Seawater Intake at Tung Chung
|
C12
|
2.4
|
0.1
|
|
Seawater Intake
|
Cooling Water Intake at HKIA South
|
C13
|
3.3
|
2.0
|
|
Seawater Intake
|
Cooling
Seawater Intake Point for SKYCITY
|
C14
|
0.0
|
2.7
|
|
Seawater Intake
|
Light Rail Transit (LRT) Tuen
Mun Ferry Pier Terminus
|
C15
|
6.5
|
9.2
|
|
Seawater Intake
|
Tuen Mun Hospital
|
C16
|
7.2
|
9.9
|
|
Seawater Intake
|
Sam Shing Estate
|
C17
|
7.7
|
10.4
|
|
Seawater Intake
|
China Cement Plant
|
C18
|
6.3
|
8.6
|
|
Typhoon Shelter
|
Tuen Mun
|
T1
|
7.0
|
9.7
|
|
Typhoon
Shelter
|
Gold Coast Marina
|
B5
|
7.4
|
10.1
|
|
Observation
Points
|
|
Boundary of
Marine Park
|
The Brothers Marine Park
|
M9
|
2.6
|
4.2
|
|
Boundary of
Marine Park
|
Sha Chau and Lung Kwu Chau Marine Park
|
M10a
|
11.0
|
12.6
|
|
Boundary of
Marine Park
|
Sha Chau and Lung Kwu Chau Marine Park
|
M10b
|
10.1
|
12.0
|
|
Boundary of
Marine Park
|
Sha Chau and Lung Kwu Chau Marine Park
|
M10c
|
7.5
|
7.8
|
|
Boundary of
Marine Park
|
Sha Chau and Lung Kwu Chau Marine Park
|
M10d
|
6.3
|
7.0
|
|
Boundary of
Marine Park
|
Sha Chau and Lung Kwu Chau Marine Park
|
M10e
|
5.3
|
6.4
|
|
Boundary of
Marine Park
|
Proposed North Lantau Marine Park
|
M11a
|
6.7
|
5.7
|
|
Boundary of
Marine Park
|
Proposed North Lantau Marine Park
|
M11b
|
5.7
|
5.0
|
|
Boundary of
Marine Park
|
Proposed North Lantau Marine Park
|
M11c
|
0.9
|
3.6
|
Notes:
1.
Sham Shui Kok was included as a dolphin habitat WSRs due to high Chinese
White Dolphin (CWD) activities in the past. According to more recent Marine Mammal Monitoring
Reports by AFCD (Available at: https://www.afcd.gov.hk/english/conservation/con_mar/con_mar_chi/con_mar_chi_chi/con_mar_chi_chi.html),
Sham Shui Kok is no longer a hotspot for CWD activities
since 2012. Thus, Sham Shui Kok is not included as CWD WSR under this EIA.
2.
The entire coastline
of North Lantau is covered with scattered coral communities. For this EIA, CR4 at Sham Shui Kok is selected as representative locations for the coral
along the coastline of North Lantau.
5.3.5.3 Note that there
are some other WSRs, such as secondary contact recreation subzones and Chinese White
Dolphin habitat cover large swath of marine waters in HK. No separate observation points would be set
for these WSRs. Instead, these WSRs
are represented by observation points of other WSRs within their area. Secondary contact recreation subzones
near the Project site are represented by observation points B1 to B7 and CR1
while Chinese White Dolphin are represented by observation points E1 and E2.
5.4.1
General
5.4.1.1 The following sections explain the
derivation of relevant assessment criteria for suspended solids, dissolved
oxygen, total inorganic nitrogen, unionized ammonia nitrogen, heavy metals and
trace organic contaminants, which are all parameters that can be directly
affected by the operational phase maintenance dredging operation and typically
assessed in past EIA modelling exercise for marine works such as AEIAR-241/2022
New Contaminated Sediment Disposal Facility to the West of Lamma
Island. Other less relevant water
quality parameters which were not assessed are therefore not included in the
following sections.
5.4.2
Suspended Solids
5.4.2.1 Elevation in suspended solids (SS) concentrations
resulting from the Project��s construction and operational activities will be assessed
against the WQO. The WQO for SS is defined
as not to raise the natural ambient level by 30%, nor cause the accumulation of
SS which may adversely affect aquatic communities. The assessment criterion is hence defined
as the WQO allowable increase in SS concentrations within the corresponding WCZs.
5.4.2.2
SS data from EPD��s routine water quality monitoring programme
from 2017 to 2021 have been analysed to determine the WQO allowable SS increase
at the WSRs. This is calculated as 30%
of the ambient level (90th percentile value) from the 2017 to 2021 baseline
marine water quality data. For each
WSR, ambient level was derived from the closest EPD water quality monitoring station. The assessment criterion for SS at each WSR
is summarized in Table 5.7.
5.4.2.3 Coral communities have been identified within the Assessment
Area. There is
no established legislative criteria for water quality for corals. For this Study, SS elevation at these
coral WSRs, their corresponding WQO standards of SS (30% increase) is derived (Table 5.7) and adopted in this EIA, following criterion of previously
approved EIA reports for assessing SS impacts on corals, including Expansion of
Hong Kong International Airport into a Three-Runway System (Register No.
AEIAR-185/2014) and New Contaminated Sediment Disposal Facility to the West of Lamma Island (Register No. AEIAR-241/2022).
Table 5.7 Allowable
Increase in SS (mg L-1) Levels for Water Sensitive Receivers and
Observation Points
|
Description
|
Location
|
Model Output Location
|
EPD
Station
|
Relevant
Depth
|
Dry
Season
|
Wet
Season
|
|
(Ambient Level) (1)
|
(WQO Allowable Change)
|
(Ambient Level) (1)
|
(WQO Allowable Change)
|
|
Fisheries Sensitive Receivers
|
|
Spawning Grounds for commercial fisheries resources
|
Spawning
Grounds for commercial fisheries resources in North Lantau
|
F1
|
NM6
|
Depth-averaged
|
28.7
|
8.6
|
17.2
|
5.2
|
|
Marine Ecological Sensitive Receivers
|
|
Marine Park
|
Sha
Chau and Lung Kwu Chau Marine Park
|
E1
|
NM6
|
Depth-averaged
|
28.7
|
8.6
|
17.2
|
5.2
|
|
Marine Park
|
The
Brothers Marine Park
|
E2
|
NM2
|
Depth-averaged
|
19.7
|
5.9
|
13.3
|
4.0
|
|
SSSI
|
Tai
Ho Bay and Tai Ho Stream SSSI
|
E4
|
NM2
|
Depth-averaged
|
19.7
|
5.9
|
13.3
|
4.0
|
|
SSSI
|
Tung
Chung Bay and San Tau Beach SSSI
|
E5
|
NM8
|
Depth-averaged
|
42.0
|
12.6
|
23.8
|
7.1
|
|
Horseshoe Crab Habitat
|
Hau
Hok Wan
|
E6
|
NM8
|
Depth-averaged
|
42.0
|
12.6
|
23.8
|
7.1
|
|
Horseshoe Crab Habitat
|
Sha
Lo Wan
|
E7
|
NM8
|
Depth-averaged
|
42.0
|
12.6
|
23.8
|
7.1
|
|
Horseshoe Crab Habitat, Mangrove Stand
|
Sham
Wat Wan
|
E8
|
NM8
|
Depth-averaged
|
42.0
|
12.6
|
23.8
|
7.1
|
|
Horseshoe Crab Habitat, Mangrove Stand
|
Yam
O Wan
|
E9
|
NM1
|
Depth-averaged
|
17.3
|
5.2
|
14.9
|
4.5
|
|
Artificial Reef and Coral Communities
|
Sha
Chau and Lung Kwu Chau Marine Park
|
CR1
|
NM6
|
Bottom
|
30.0
|
9.0
|
17.7
|
5.3
|
|
Coral Communities
|
The
Brothers Islands (West Brother)
|
CR2
|
NM3
|
Bottom
|
22.8
|
6.8
|
19.6
|
5.9
|
|
Coral Communities
|
North
of Sheung Sha Chau
|
CR3
|
NM6
|
Bottom
|
30.0
|
9.0
|
17.7
|
5.3
|
|
Coral Communities
|
Sham
Shui Kok
|
CR4
|
NM2
|
Bottom
|
28.0
|
8.4
|
19.1
|
5.7
|
|
Artificial Reef
|
HKIA
Approach Area
|
CLK1
|
NM3
|
Bottom
|
22.8
|
6.8
|
19.6
|
5.9
|
|
Artificial Reef
|
HKIA
Approach Area
|
CLK2
|
NM3
|
Bottom
|
22.8
|
6.8
|
19.6
|
5.9
|
|
Artificial Reef
|
HKIA
Approach Area
|
CLK3
|
NM3
|
Bottom
|
22.8
|
6.8
|
19.6
|
5.9
|
|
Artificial Reef
|
HKIA
Approach Area
|
CLK4
|
NM3
|
Bottom
|
22.8
|
6.8
|
19.6
|
5.9
|
|
Artificial Reef
|
HKIA
Approach Area
|
CLK5
|
NM3
|
Bottom
|
22.8
|
6.8
|
19.6
|
5.9
|
|
Water Sensitive Receivers
|
|
Non-gazetted beach
|
Lung
Kwu Sheung Tan
|
B1
|
NM5
|
Depth-averaged
|
22.3
|
6.7
|
19.6
|
5.9
|
|
Non-gazetted beach
|
Lung
Tsai / Lung Kwu Tan
|
B2
|
NM5
|
Depth-averaged
|
22.3
|
6.7
|
19.6
|
5.9
|
|
Gazetted Beach
|
Butterfly
Beach
|
B3
|
NM2
|
Depth-averaged
|
19.7
|
5.9
|
13.3
|
4.0
|
|
Gazetted Beach
|
Cafeteria
New Beach
|
B4
|
NM2
|
Depth-averaged
|
19.7
|
5.9
|
13.3
|
4.0
|
|
Gazetted Beach
|
Gold
Coast Marina / Golden Beach
|
B5
|
NM2
|
Depth-averaged
|
19.7
|
5.9
|
13.3
|
4.0
|
|
Gazetted Beach
|
Castle Peak Beach
|
B6
|
NM2
|
Depth-averaged
|
19.7
|
5.9
|
13.3
|
4.0
|
|
Gazetted Beach
|
Kadoorie Beach
|
B7
|
NM2
|
Depth-averaged
|
19.7
|
5.9
|
13.3
|
4.0
|
|
Gazetted Beach
|
Cafeteria Old Beach
|
B8
|
NM2
|
Depth-averaged
|
19.7
|
5.9
|
13.3
|
4.0
|
|
Seawater Intake
|
Castle Peak Power Station Cooling Water Intake
|
C1
|
NM5
|
Depth-averaged
|
22.3
|
6.7
|
19.6
|
5.9
|
|
Seawater Intake
|
Cooling Water Intake for Shiu Wing
Steel Mills
|
C2
|
NM3
|
Depth-averaged
|
20.0
|
6.0
|
15.7
|
4.7
|
|
Seawater Intake
|
WSD Seawater Intake at Tuen Mun (2)
|
C3
|
NM2
|
Depth-averaged
|
19.7
|
5.9
|
13.3
|
4.0
|
|
Seawater Intake
|
Proposed Lok On Pai Intake (Pumping Station)
|
C4
|
NM2
|
Depth-averaged
|
19.7
|
5.9
|
13.3
|
4.0
|
|
Seawater Intake
|
Future Seawater Intake Point for Sunny Bay
|
C5
|
NM1
|
Depth-averaged
|
17.3
|
5.2
|
14.9
|
4.5
|
|
Seawater Intake
|
Proposed Ta Pang Po Intake (Pumping Station)
|
C6
|
NM1
|
Depth-averaged
|
17.3
|
5.2
|
14.9
|
4.5
|
|
Seawater Intake
|
Future Seawater Intake Point for Tung Chung East
|
C8
|
NM3
|
Depth-averaged
|
20.0
|
6.0
|
15.7
|
4.7
|
|
Seawater Intake
|
HKP Intake
|
C9
|
NM3
|
Depth-averaged
|
20.0
|
6.0
|
15.7
|
4.7
|
|
Seawater Intake
|
Cooling Water Intake at HKIA North
|
C10
|
NM3
|
Depth-averaged
|
20.0
|
6.0
|
15.7
|
4.7
|
|
Seawater Intake
|
Future Seawater Intake at HKIA East
|
C11
|
NM3
|
Depth-averaged
|
20.0
|
6.0
|
15.7
|
4.7
|
|
Seawater Intake
|
Seawater Intake at Tung Chung
|
C12
|
NM3
|
Depth-averaged
|
20.0
|
6.0
|
15.7
|
4.7
|
|
Seawater Intake
|
Cooling water Intake at HKIA South
|
C13
|
NM8
|
Depth-averaged
|
42.0
|
12.6
|
23.8
|
7.1
|
|
Seawater Intake
|
Cooling Seawater Intake Point for SKYCITY
|
C14
|
NM3
|
Depth-averaged
|
20.0
|
6.0
|
15.7
|
4.7
|
|
Seawater Intake
|
LRT Tuen Mun Ferry Pier Terminus
|
C15
|
NM2
|
Depth-averaged
|
19.7
|
5.9
|
13.3
|
4.0
|
|
Seawater Intake
|
Tuen Mun Hospital
|
C16
|
NM2
|
Depth-averaged
|
28.0
|
8.4
|
19.1
|
5.7
|
|
Seawater Intake
|
Sam Shing Estate
|
C17
|
NM2
|
Depth-averaged
|
28.0
|
8.4
|
19.1
|
5.7
|
|
Seawater Intake
|
China Cement Plant
|
C18
|
NM5
|
Depth-averaged
|
22.0
|
6.6
|
36.1
|
10.8
|
|
Typhoon Shelter
|
Tuen
Mun
|
T1
|
NM2
|
Depth-averaged
|
19.7
|
5.9
|
13.3
|
4.0
|
|
Observation Points
|
|
Boundary of Marine Park
|
The Brothers Marine Park
|
M9
|
NM3
|
Depth-averaged
|
20.0
|
6.0
|
15.7
|
4.7
|
|
Boundary of Marine Park
|
Sha
Chau and Lung Kwu Chau Marine Park
|
M10a
|
NM5
|
Depth-averaged
|
22.3
|
6.7
|
19.6
|
5.9
|
|
Boundary of Marine Park
|
Sha
Chau and Lung Kwu Chau Marine Park
|
M10b
|
NM5
|
Depth-averaged
|
22.3
|
6.7
|
19.6
|
5.9
|
|
Boundary of Marine Park
|
Sha
Chau and Lung Kwu Chau Marine Park
|
M10c
|
NM6
|
Depth-averaged
|
28.7
|
8.6
|
17.2
|
5.2
|
|
Boundary of Marine Park
|
Sha
Chau and Lung Kwu Chau Marine Park
|
M10d
|
NM6
|
Depth-averaged
|
28.7
|
8.6
|
17.2
|
5.2
|
|
Boundary of Marine Park
|
Sha
Chau and Lung Kwu Chau Marine Park
|
M10e
|
NM6
|
Depth-averaged
|
28.7
|
8.6
|
17.2
|
5.2
|
|
Boundary of Marine Park
|
Proposed North Lantau Marine Park
|
M11a
|
NM8
|
Depth-averaged
|
42.0
|
12.6
|
23.8
|
7.1
|
|
Boundary of Marine Park
|
Proposed North Lantau Marine Park
|
M11b
|
NM8
|
Depth-averaged
|
42.0
|
12.6
|
23.8
|
7.1
|
|
Boundary of Marine Park
|
Proposed North Lantau Marine Park
|
M11c
|
NM3
|
Depth-averaged
|
20.0
|
6.0
|
15.7
|
4.7
|
Notes:
1. Ambient
level is calculated as 90th percentile of the EPD routine water
quality monitoring data (2017-2021) at respective EPD station close to the
WSRs.
2. It
should be noted that the background level SS concentrations recorded at NM2
already exceeds the WSD��s SS criterion of 10 mg L-1. For WSD intake WSRs where baseline SS
levels exceed 10 mg L-1, WQO criterion of elevation not exceeding
30% of the ambient level would be adopted.
5.4.2.4
For seawater intake WSRs, the Water Supplies
Department (WSD) has a set of standards for the quality of abstracted seawater.
The corresponding water quality
criteria for WSD seawater intakes are presented in Table 5.8.
5.4.2.5
The two nearest seawater intakes located within the
embayment between the Airport Island and the HKP Island (C9 and C14) are both
seawater intakes for cooling water (i.e. not WSD intakes) and are not known to
be very sensitive to SS elevation.
For this EIA, water quality impact assessment would be based on the
corresponding WQO criterion of elevation not exceeding 30% of the ambient
level, following the similar approach adopted in the nearby approved EIA of
3RS.
Table 5.8 WSD��s
Water Quality Criteria for Water at Seawater Intakes
|
Parameter
|
Criterion
|
|
Colour (HU)
|
< 20
|
|
Turbidity (NTU)
|
< 10
|
|
Threshold Odour No.
|
< 100
|
|
Ammoniacal Nitrogen (mg L-1)
|
< 1
|
|
Suspended Solids (mg L-1)
|
< 10
|
|
Dissolved Oxygen (mg L-1)
|
> 2
|
|
5-day Biochemical Oxygen Demand (mg L-1)
|
< 10
|
|
Synthetic Detergents (mg L-1)
|
< 5
|
|
E. coli (cfu/100mL)
|
< 20,000
|
5.4.3
Dissolved Oxygen
5.4.3.1 Dissolved oxygen (DO) depletion resulting from the Project��s construction
and operational activities will be assessed against the WQO. The assessment criterion is defined as the
WQO allowable changes in dissolved oxygen (DO) levels at the WSRs. The depletion of DO in the water column is
not expected to affect the operation of seawater intakes; therefore, no assessment
criteria for seawater intake WSRs are identified, except for WSD intakes where the
WSD DO criterion is adopted (i.e. C3).
For the purpose of assessment under this EIA Study, the WQO criterion
for DO is applied for these non-WSD seawater intakes (i.e. C1, C2, C4 to C18).
5.4.3.2 DO data from EPD��s routine water quality monitoring programme
from 2017 to 2021 have been analyzed to determine WQO allowable changes in DO levels
at the WSRs. Allowable DO change is
calculated as the ambient DO level minus the WQO, i.e. 4 mg L-1 for depth-averaged,
surface and middle layers, and 2 mg L-1 for bottom layer. Ambient level is calculated as the 10th
percentile value from the 2017 to 2021 marine water quality data. For each WSR, ambient level was derived from
the closest EPD water quality monitoring station. The assessment criterion for DO at each WSR
is summarized in Table 5.9. Note that the WQO
criterion for DO is specifically based on ��90% of the sampling occasions during
the whole year��, therefore, the assessment criterion adopted under this Study
was also based on the annual 10th-percentile.
Table 5.9 Allowable
DO Depletion (mg L-1) for Water Sensitive Receivers and Observation
Points
|
Description
|
Location
|
Model
Output Location
|
EPD Station
|
Relevant Depth
|
Annual Ambient Level (1)
|
Annual WQO Allowable Change
|
|
Spawning Grounds for
commercial fisheries resources
|
Spawning Grounds for commercial fisheries
resources in North Lantau
|
F1
|
NM6
|
Depth-averaged
|
4.70
|
0.7
|
|
Marine Park
|
Sha Chau and Lung Kwu Chau Marine Park
|
E1
|
NM6
|
Depth-averaged
|
4.70
|
0.7
|
|
Marine Park
|
The Brothers Marine Park
|
E2
|
NM2
|
Depth-averaged
|
4.45
|
0.5
|
|
SSSI
|
Tai Ho Bay and Tai Ho Stream SSSI
|
E4
|
NM2
|
Depth-averaged
|
4.45
|
0.5
|
|
SSSI
|
Tung Chung Bay and San Tau Beach SSSI
|
E5
|
NM8
|
Depth-averaged
|
4.59
|
0.6
|
|
Horseshoe
Crab Habitat
|
Hau Hok Wan
|
E6
|
NM8
|
Depth-averaged
|
4.59
|
0.6
|
|
Horseshoe Crab
Habitat
|
Sha Lo Wan
|
E7
|
NM8
|
Depth-averaged
|
4.59
|
0.6
|
|
Horseshoe
Crab Habitat, Mangrove Stand
|
Sham Wat Wan
|
E8
|
NM8
|
Depth-averaged
|
4.59
|
0.6
|
|
Horseshoe
Crab Habitat, Mangrove Stand
|
Yam O Wan
|
E9
|
NM1
|
Depth-averaged
|
4.17
|
0.2
|
|
Artificial
Reef and Coral Communities
|
Sha Chau and Lung Kwu Chau Marine Park
|
CR1
|
NM6
|
Bottom
|
4.50
|
2.5
|
|
Coral
Communities
|
The Brothers Islands (West Brother)
|
CR2
|
NM3
|
Bottom
|
3.50
|
1.5
|
|
Coral
Communities
|
North of Sheung Sha Chau
|
CR3
|
NM6
|
Bottom
|
4.50
|
2.5
|
|
Coral
Communities
|
Sham Shui Kok
|
CR4
|
NM2
|
Bottom
|
3.66
|
1.7
|
|
Artificial
Reef
|
HKIA Approach Area
|
CLK1
|
NM3
|
Bottom
|
3.50
|
1.5
|
|
Artificial
Reef
|
HKIA Approach Area
|
CLK2
|
NM3
|
Bottom
|
3.50
|
1.5
|
|
Artificial
Reef
|
HKIA Approach Area
|
CLK3
|
NM3
|
Bottom
|
3.50
|
1.5
|
|
Artificial
Reef
|
HKIA Approach Area
|
CLK4
|
NM3
|
Bottom
|
3.50
|
1.5
|
|
Artificial
Reef
|
HKIA Approach Area
|
CLK5
|
NM3
|
Bottom
|
3.50
|
1.5
|
|
Non-gazetted
beach
|
Lung Kwu Sheung Tan
|
B1
|
NM5
|
Depth-averaged
|
4.23
|
0.2
|
|
Non-gazetted
beach
|
Lung Tsai / Lung Kwu Tan
|
B2
|
NM5
|
Depth-averaged
|
4.23
|
0.2
|
|
Gazetted
Beach
|
Butterfly Beach
|
B3
|
NM2
|
Depth-averaged
|
4.45
|
0.5
|
|
Gazetted
Beach
|
Cafeteria New Beach
|
B4
|
NM2
|
Depth-averaged
|
4.45
|
0.5
|
|
Gazetted
Beach
|
Gold Coast Marina / Golden Beach
|
B5
|
NM2
|
Depth-averaged
|
4.45
|
0.5
|
|
Gazetted
Beach
|
Castle Peak Beach
|
B6
|
NM2
|
Depth-averaged
|
4.45
|
0.5
|
|
Gazetted Beach
|
Kadoorie Beach
|
B7
|
NM2
|
Depth-averaged
|
4.45
|
0.5
|
|
Gazetted
Beach
|
Cafeteria Old Beach
|
B8
|
NM2
|
Depth-averaged
|
4.45
|
0.5
|
|
Seawater
Intake
|
Castle Peak Power Station Cooling Water Intake
|
C1
|
NM5
|
Depth-averaged
|
4.23
|
0.2
|
|
Seawater
Intake
|
Cooling Water Intake for Shiu
Wing Steel Mills
|
C2
|
NM3
|
Depth-averaged
|
4.32
|
0.3
|
|
Seawater
Intake
|
WSD Seawater Intake at Tuen
Mun
|
C3
|
NM2
|
Depth-averaged
|
4.45
|
2.5
|
|
Seawater
Intake
|
Proposed Lok On Pai Intake (Pumping Station)
|
C4
|
NM2
|
Depth-averaged
|
4.45
|
0.5
|
|
Seawater
Intake
|
Future seawater Intake Point for Sunny Bay
|
C5
|
NM1
|
Depth-averaged
|
4.17
|
0.2
|
|
Seawater
Intake
|
Proposed Ta Pang Po Intake (Pumping Station)
|
C6
|
NM1
|
Depth-averaged
|
4.17
|
0.2
|
|
Seawater
Intake
|
Future seawater Intake Point for Tung Chung East
|
C8
|
NM3
|
Depth-averaged
|
4.32
|
0.3
|
|
Seawater
Intake
|
HKP Intake
|
C9
|
NM3
|
Depth-averaged
|
4.32
|
0.3
|
|
Seawater
Intake
|
Cooling Water Intake at HKIA North
|
C10
|
NM3
|
Depth-averaged
|
4.32
|
0.3
|
|
Seawater
Intake
|
Future Seawater Intake at HKIA East
|
C11
|
NM3
|
Depth-averaged
|
4.32
|
0.3
|
|
Seawater
Intake
|
Seawater Intake at Tung Chung
|
C12
|
NM3
|
Depth-averaged
|
4.32
|
0.3
|
|
Seawater
Intake
|
Cooling Water Intake at HKIA South
|
C13
|
NM8
|
Depth-averaged
|
4.59
|
0.6
|
|
Seawater
Intake
|
Cooling Seawater Intake Point for SKYCITY
|
C14
|
NM3
|
Depth-averaged
|
4.32
|
0.3
|
|
Seawater
Intake
|
LRT Tuen Mun Ferry Pier
Terminus
|
C15
|
NM2
|
Depth-averaged
|
4.45
|
0.5
|
|
Seawater
Intake
|
Tuen Mun Hospital
|
C16
|
NM2
|
Depth-averaged
|
4.45
|
0.5
|
|
Seawater
Intake
|
Sam Shing Estate
|
C17
|
NM2
|
Depth-averaged
|
4.45
|
0.5
|
|
Seawater
Intake
|
China Cement Plant
|
C18
|
NM5
|
Depth-averaged
|
4.23
|
0.2
|
|
Typhoon
Shelter
|
Tuen Mun
|
T1
|
NM2
|
Depth-averaged
|
4.45
|
0.5
|
|
Boundary of
Marine Park
|
The Brothers Marine Park
|
M9
|
NM3
|
Depth-averaged
|
4.32
|
0.3
|
|
Boundary of
Marine Park
|
Sha Chau and Lung Kwu Chau Marine Park
|
M10a
|
NM5
|
Depth-averaged
|
4.23
|
0.2
|
|
Boundary of
Marine Park
|
Sha Chau and Lung Kwu Chau Marine Park
|
M10b
|
NM5
|
Depth-averaged
|
4.23
|
0.2
|
|
Boundary of
Marine Park
|
Sha Chau and Lung Kwu Chau Marine Park
|
M10c
|
NM6
|
Depth-averaged
|
4.70
|
0.7
|
|
Boundary of
Marine Park
|
Sha Chau and Lung Kwu Chau Marine Park
|
M10d
|
NM6
|
Depth-averaged
|
4.70
|
0.7
|
|
Boundary of
Marine Park
|
Sha Chau and Lung Kwu Chau Marine Park
|
M10e
|
NM6
|
Depth-averaged
|
4.70
|
0.7
|
|
Boundary of
Marine Park
|
Proposed North Lantau Marine Park
|
M11a
|
NM8
|
Depth-averaged
|
4.59
|
0.6
|
|
Boundary of
Marine Park
|
Proposed North Lantau Marine Park
|
M11b
|
NM8
|
Depth-averaged
|
4.59
|
0.6
|
|
Boundary of
Marine Park
|
Proposed North Lantau Marine Park
|
M11c
|
NM3
|
Depth-averaged
|
4.32
|
0.3
|
Notes:
1.
Ambient
level is calculated as 10th percentile of the EPD routine water quality monitoring
data (2017-2021) at respective EPD station close to the WSRs.
5.4.4
Sediment Deposition
5.4.4.1
Impacts to artificial reefs and corals will
be assessed with regards to sediment deposition. The assessment criterion of 200 g m-2
day-1, which represents an indicative level above which could result
in moderate to severe impact on corals, has been used in approved EIA Reports ()() and has been adopted here.
5.4.5
Nutrients
5.4.5.1 Elevation in the levels of nutrients as a result of the Project��s construction
activities, if any, will be compared against the respective WQOs (Table 5.1 refers).
5.4.6
Dissolved Metals
and Organics Contaminants
5.4.6.1
Assessment of dissolved metals and organics
contaminants will be conducted based on the assessment
criteria presented in Table 5.10. These criteria
are applicable to all WSRs except for seawater intakes which are not deemed sensitive
to change in these contaminants levels.
Table 5.10 Summary
of Assessment Criteria for Dissolved Metals and Organic Contaminants
|
Parameter
|
Unit
|
Assessment Criteria Adopted
|
|
Metals
|
|
|
|
Cadmium (Cd)
|
mg L-1
|
5.5 (1)
|
|
Chromium (Cr)
|
mg L-1
|
4.4 (1)
|
|
Copper (Cu)
|
mg L-1
|
1.3 (1)
|
|
Nickel (Ni)
|
mg L-1
|
70 (1)
|
|
Lead (Pb)
|
mg L-1
|
4.4 (1)
|
|
Zinc (Zn)
|
mg L-1
|
8 (1)
|
|
Mercury (Hg)
|
mg L-1
|
0.4 (1)
|
|
Arsenic (As)
|
mg L-1
|
13 (1)
|
|
Silver (Ag)
|
mg L-1
|
1.4 (1)
|
|
PAHs
|
|
Total PAHs
|
mg L-1
|
0.2 (2)
|
|
PCBs
|
|
|
|
Total PCBs
|
mg L-1
|
0.03 (2)
|
|
Organotins
|
|
|
|
Tributyltin (TBT)
|
mg L-1
|
0.006 (2)
|
Notes:
(1) Australian and New Zealand Guidelines for Fresh and Marine
Water Quality. Default guideline
value for protection for 95% Species in Marine water. Available at: https://www.waterquality.gov.au/anz-guidelines/guideline-values/default/water-quality-toxicants/search
For chromium, the more stringent standard for Cr(VI)
is adopted. For arsenic, there is
no standard for marine water, standard for freshwater for As(V) was thus
adopted which is more conservative than that for As(III).
(2) U.S. Environmental Protection Agency, National
Recommended Water Quality Criteria, 2009.
(https://www.epa.gov/wqc/national-recommended-water-quality-criteria-aquatic-life-criteria-table). The Criteria Continuous Concentration
(CCC) is an estimate of the highest concentration of a material in surface
water (ie saltwater) to which an aquatic community
can be exposed indefinitely without resulting in an unacceptable effect. CCC is used as the criterion of the
respective compounds in this study.
5.5.1.1
The methodology employed to assess potential water quality impacts
associated with the construction and operation of the Project is presented in the
Working Paper on Water Quality Modelling Plan
(Appendix 5.1) and has been based on the information presented in the Project Description
(Section 2). Full details of the scenarios examined in
the modelling works and the uncertainties in various aspects of the modelling assessment
are provided in Working Paper on Water Quality
Modelling Plan (Appendix 5.1). Verification of hydrodynamic model has been
provided in Appendix 5.1. The WSRs assessed are presented in Figure 5.1.
5.6.1.1
The key construction and operation activities of the Project are discussed
in Sections 2.7 and 2.8. Potential sources of impacts to water quality
arising from the Project may occur during both construction and operation activities,
including:
5.6.2
Construction Phase:
��
Marine construction works including piling for marine facilities
and marine viaduct;
��
Construction site runoff and wastewater generated from land-based activities;
and
��
Generation of wastewater and sewage from workforce
5.6.3
Operational Phase:
��
Change in flow regime due to presence of floating structure and bridge piles
which may affect the water quality in the bay area;
��
Change in water quality due to maintenance dredging (SS elevation and increased
sedimentation, dissolved oxygen depletion and release of sediment-bounded nutrients);
��
Generation of wastewater, sewage from staff, visitors etc.;
��
Potential oil spillage associated with the operation of the vessels; and
��
Generation of road runoff
5.7
Impact Assessment - Construction Phase
5.7.1
Sediment
Disturbance and Wastewater generated from Marine-Based Construction Activities
5.7.1.1
As discussed in Section 2.7, there will not be
any open sea dredging for construction phase. The construction of marine viaduct
section would involve the installation of 4 set of piers (3 piles for each set,
totalled 12 piles, each with diameter of about 1.8 m) across the Tung Chung
Navigation Channel (Appendix 5.6 referred). After installation of silt curtain(s) to
surround the active marine works area for the marine viaduct, a temporary working
platform that sits on support casings (with or without reinforcing by
mini-piles) would be installed. The
support casings will be positioned to the seabed by vibratory hammer from a
barge. Such operation is expected
to result in limited level of localized disturbance to bottom sediment,
particularly when controlled by the surrounding silt curtain. In case mini-piles support is needed,
the temporary support casings will be lowered until reaching the rock head
until rock socket is formed. After
securing the support casings, a temporary working platform would be installed
on top of the casings and all subsequent piling works would be conducted by
piling plants on top of the temporary working platform. Bored piling for the marine viaduct crossing
the Tung Chung Navigation Channel would be conducted with the silt curtain
remains in place. At most two
marine piles will be installed/ constructed concurrently at the viaduct works
area across Tung Chung Navigation Channel during the construction phase. Bored piling would be undertaken inside steel
casing within silt curtain, which effectively contains sediment loss from the process. Illustrative diagram of steel casing
with silt curtain is shown in Exhibit 5.1. Figure 2.5(a) shows the
detailed work arrangements for marine works marine viaduct as well as the
associated use of silt curtain. After
the installation bored piles, the rest of the pile installation would be conducted
in dry environment within precast pier shell, and thus would not result in any direct
water quality impact. The locations
and configurations of marine piles under this Project are show in Exhibit 5.2, Exhibit 5.3, Exhibit 5.4and Appendix 5.6. Given the small scale of works (no open
dredging, maximum two concurrent pile installation) and the use of silt curtain
for sediment control, the potential disturbance of bottom sediment is expected
to be limited and thus no unacceptable water quality impact from the proposed
marine construction works for the marine viaduct would be expected.
Exhibit 5.1 Steel
Casing Installation with Silt Curtain
Note:
This cross-sectional view has been simplified for clarity and is not to scale.
Exhibit 5.2 Design
of Wave Attenuator
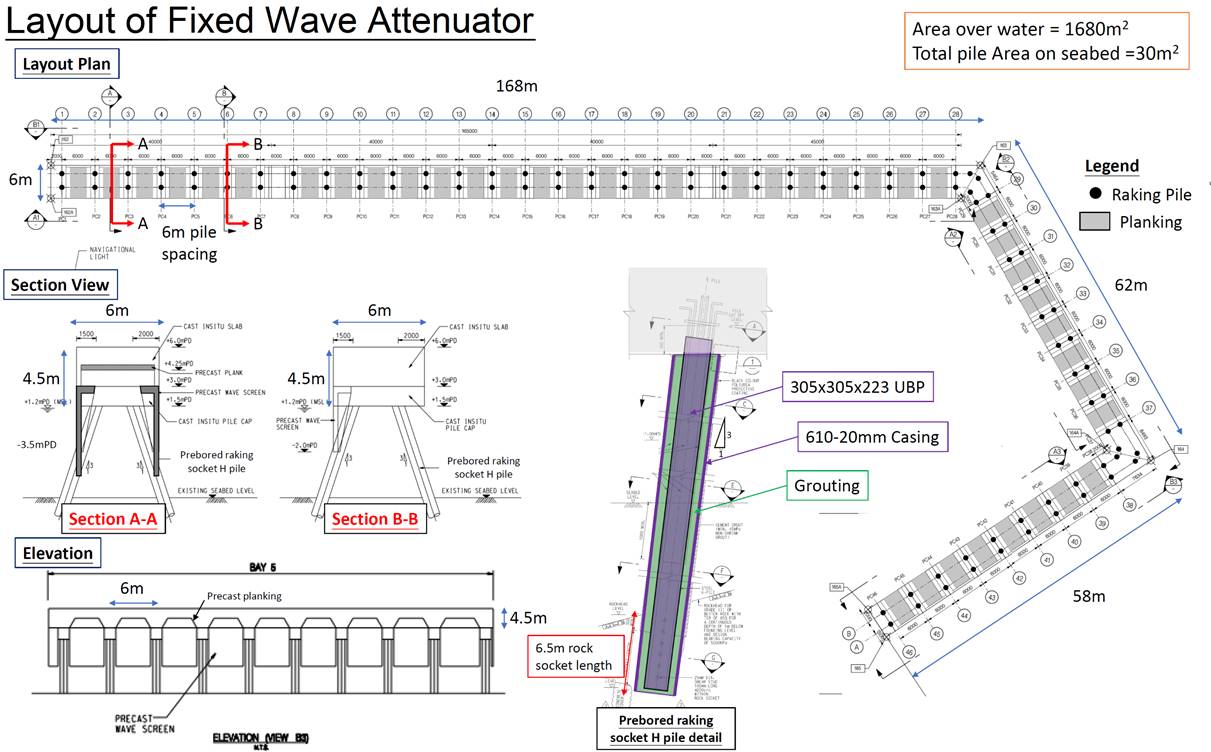
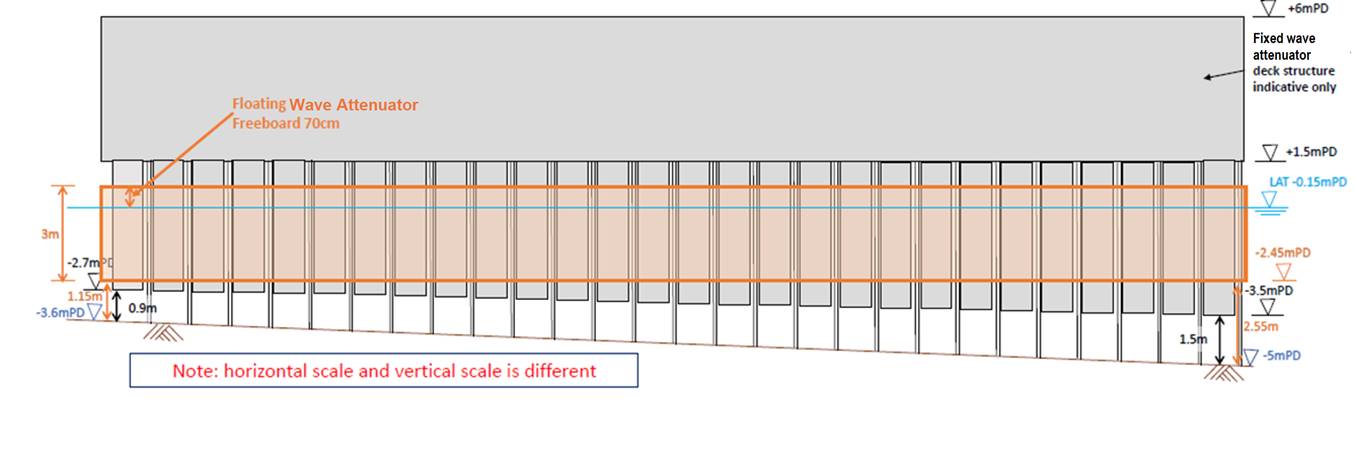
Exhibit 5.3 Indicative
Pile Locations for SkyPier (Option MF-B)
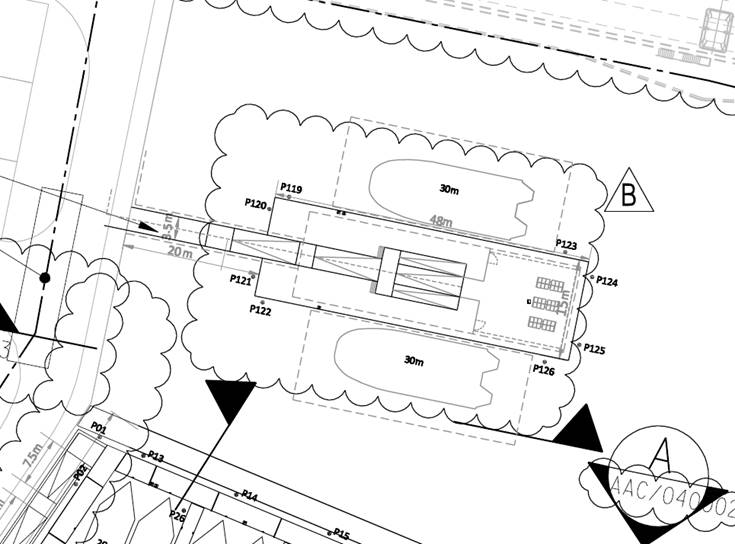
Exhibit 5.4 Indicative
Pile Locations for Berthing Area (Option MF-B)

5.7.1.2
Similar to the case of marine construction at the marine viaduct, marine
construction works for the marine facilities would only commence after the
installation of silt curtain surrounding the corresponding works area. For the marine facilities, there will be
around 99 piles (about 0.6 m diameter) for the wave attenuator, around 8 piles
(about 0.6 m diameter) for the SKYCITY Pier and about 118 piles for the
berthing area (about 0.6 m diameter).
The floating pontoon (for both SKYCITY Pier and the floating platforms
of the berthing facilities) as well as the wave attenuator would be installed
using temporary working platform (illustrated in Figure 2.5(e)). The temporary working
platform will be erected and assembled at piling locations by deploying derrick
lighter/ crane barge. Foundation piles
and guide piles for supporting or anchoring of the marine facilities will be driven
into seabed/rockhead level
by piling machine. The pontoons for the floating platforms
of the marine facilities and for the SKYCITY Pier will be constructed at an
existing fabrication yard outside of Hong Kong, and will arrive at the project
site via marine access, and then be lifted and secured by segment with guide
piles by derrick lighter / crane barge.
For the SKYCITY PIER and wave attenuator, the pile casings will first be
sunk down to the bed rock using drilling rig on the temporary working platform,
then the socketed H-piles
will be installed by crane barge, followed up the construction of the
superstructure on top. At most two
marine piles will be installed/ constructed concurrently at the proposed marine
facilities work area during the construction phase. No open sea dredging will be involved in
either case. These works may result
in minor disturbance to the bottom sediment and temporary localized elevation of
turbidity which subside in a short period of time. Figure 2.5(e) shows the
detailed work arrangements for marine works for marine facilities as well as
the associated use of silt curtain.
Given the small scale of works (no open sea dredging, maximum two
concurrent pile installation) and the use of silt curtain for sediment control,
the potential disturbance of bottom sediment is expected to be limited and thus
no unacceptable water quality impact from the proposed marine construction works
for the marine facilities would be expected.
5.7.1.3
Good site practices listed under Section 5.9.1 should be implemented to minimize
risk of potential water quality impact from marine construction works.
5.7.2
Construction Site Runoff and Wastewater generated from Land-Based Construction
Activities
5.7.2.1
Construction site runoff would be generated from runoff of earth working
area and stockpiles, wastewater from dust suppression sprays and wheel washing facilities
and wastewater from concrete washings and other grouting materials. These surface runoff
contains high concentration of suspended solids, which would cause potential blockage
of drainage channels and increase in suspended solids and turbidity levels in the
WSRs in vicinity of the project area.
Mitigation measures listed under Section
5.9 should be implemented to minimize the risk of potential water quality impact
from construction site runoff and wastewater generated from land-based works. No unacceptable impacts on water quality
is anticipated with the implementation of appropriate measures.
5.7.3
Wastewater and Sewage generated from Workforce
5.7.3.1
Sewage will arise from the construction workforce and site office��s
sanitary facilities. Suitable sanitary
facilities such as chemical toilets will be provided onsite. These chemical toilets would be regularly
maintained, cleaned and emptied by licensed contractor for off-site disposal to
avoid any environmental nuisance. No
onsite discharge from these chemical toilets nor from construction work vessel would
be allowed. Therefore, no unacceptable
water quality impacts to sensitive receivers are anticipated.
5.8.1
Change
in Flow Regime due to Presence of Floating Structure and Viaduct Piers
5.8.1.1
The presence of viaduct piers across the Tung Chung Navigation Channel
under this Project is expected to result in increased drag across the channel. Similarly, the proposed development of berthing
facilities within the embayment between the Airport Island and HKP Island requires
the installation of piles as well as wave attenuator, which could slow down current
to allow safe navigation and mooring.
These project elements would affect flow regime in the proximity and was
required to be assessed in the EIA Study Brief for this Project. For this EIA, a modelling exercise has been
conducted to estimate the change in flow regime in the surrounding with the presence
of project elements.
5.8.1.2
Fixed wave attenuator would be provided at the south-western corner
of the embayment between the Airport Island and HKP Island. Based on the latest design information, the
fixed wave attenuator covers the water column approximately from about -2.7mPD
up to +6mPD at the most shallow end close to the
Airport Island, leaving about 0.9m of the water column near seabed unobstructed. At the deepest end of the wave
attenuator, it covers the water column approximately from about -3.5mPD up to +6mPD, leaving about
1.5m of the water column near seabed unobstructed. Horizontally, the fixed wave attenuator have a total length of approximately 290m. Design of the wave attenuator is shown
in Exhibit 5.2 below. There are also other small piles for various
facilities under this Project, including the SKYCITY Pier (indicative pile locations
shown in Exhibit 5.3), berthing
facilities (indicative pile locations shown in Exhibit 5.4) under this
Project which would also affect the hydrodynamic within the embayment and have
been taken into account in the modelling exercise.
5.8.1.3
Note that there is potential option of floating wave attenuator (), where the
wave-attenuating floats on the top layer of the water column to block off wave
but not the majority of the circulation.
Preliminary design information indicated the floating wave attenuator
would about 3 m thick vertically, and with 70 cm freeboard and 2.3 m of
submerged part to block off wave energy.
This means the blocked off part of the water column is significantly
less than that of the fixed wave attenuator option. Comparison of blocked off part of the
water column by fixed and floating wave attenuator is given in the lower part
of Exhibit 5.2. As shown, the fixed wave attenuator
would block off more of the water column when compared with it
floating counterpart. Thus the adoption of fixed wave attenuator is the worst case
scenario for conservative assessment under this Study. Note that while maintenance
dredging would likely be required during operation in the proposed marine facilities,
the scope of maintenance dredging would be to maintain the seabed level within the
area of marine facilities at about the current level. It is because the current seabed level provides
enough depth for the designated type of marine vessels to operate. Based on the latest design information, maintenance
dredging would only be required if siltation within the area of marine facilities
result in seabed level above the level shown in Exhibit 5.5 below and the
maintenance dredging would only restore the seabed level to the current level.
Exhibit 5.5 Threshold Seabed Level for Triggering Maintenance Dredging
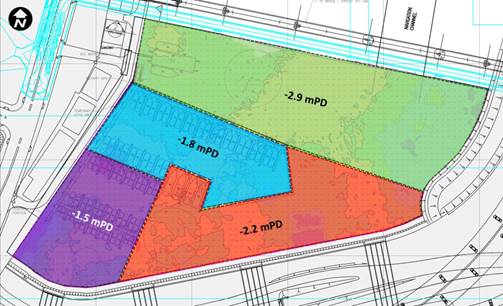
5.8.1.4
Two modelling scenarios have been conducted as described as scenarios
O1 and O2 in the Working Paper (Appendix 5.1). Scenario O1 represents the baseline scenario
in the future horizon which takes into account major completed
reclamation in the model domain (including the Third Runway development of the HKIA,
Tung Chung New Town East development, Road P1, Sunny Bay and
Lung Kwu Tan) as well as existing and future bridges near
the Project (including the traffic bridges of the North Lantau Express Highway and
Chek Lap Kok South Road, as
well as the SkyPier Terminal Bonded Bridge and Airportcity Link).
In addition to the reclamation and bridges considered in scenario O1, scenario
O2 takes into account project elements which have notable effect on the flow regime,
including the bridge piers (consists of 4 sets of 3 piles of 1.8m in diameter, i.e.
totalled 12) of the proposed marine viaduct at the Tung Chung Navigation
Channel, the proposed fixed wave attenuator (and 99 no. of associated piles;
fixed wave attenuator assessed for conservative reason) as well as other
smaller piles for proposed SKYCITY Pier (8 piles each about 0.6 m in diameter),
and berthing facilities (118 piles each about 0.6 m in diameter, including
gangway). Appendix 5.5 detailed the
considerations for incorporation of existing and proposed piles, proposed wave
attenuator and box culverts around the marine facilities and marine viaducts
under this Project. The predicted tidal
discharge at a number of selected major cross sections under both scenarios are
estimated and compared to demonstrate the potential change in flow regime as a result
of the proposed marine viaduct across the Tung Chung Navigation Channel, and the
embayment between the Airport Island and the HKP. Exhibit 5.6 shows the locations
of the selected major cross sections.
A summary of tidal discharge across these cross sections is provided in Table 5.11. Percentile distribution plots for tidal discharge
across major cross sections are presented in Table 5.12. Time series
plot for instantaneous tidal discharges across these cross sections are presented
in Table 5.13. As shown, the change in tidal discharge between
baseline scenario and project scenario at the west and south of Airport, Tung Chung
and Urmston midway were small, except the east of Airport where it is located at
the opening of the embayment. This shows
that the proposed ATCL marine viaduct across the Tung Chung Navigation Channel as
well as the proposed berthing facilities would have limited impact on the flow regime
at the farther regime of the western waters, including the Urmston Road to the north
of the Project, as well as the Tung Chung Bay and the Tung Chung Navigation Channel. The highest changes among these 4 cross
sections is predicted under flood tide of dry season, where increase up to 1.2%
was predicted. The predicted
changes at other cross sections under other season and tide condition are even
lower. Unacceptable change in flow regime
from the Project during operation on these areas was not expected. The change of tidal discharge across the
cross section of Airport East is notable, particularly for the flooding tide. It is because the cross section is
relatively small and its tidal flow is not symmetric, i.e. water flow southward
predominantly regardless of tide. This
means a substantially weaker and shorter time for northward flow (consistent
with typical flooding current direction), thus resulting in a more notable
percentage changes because of the smaller average tidal discharge. As shown in Table 5.13, the model
prediction shows that the Project does not materially alter the flow regime in
terms of phase and direction of the tidal flow. Given the embayment itself is highly
developed and serves mostly navigational and industrial (i.e. cooling)
purposes, such changes is not expected to be of
unacceptable impact to these identified beneficial uses. Exhibit 5.7 shows the
predicted water temperature at the existing seawater intake at C9 (of the HKP)
for HKP (). As shown, no notable deviation of water
temperature at C9 was predicted under the baseline and project scenarios in both
seasons. The predicted changes in
water temperature would be below 0.1��C, which is insignificant, well below the
corresponding WQO criterion of 2��C and would not have any substantial impact on
the corresponding beneficial use.
Exhibit 5.6 Indicative Locations
for the Major Cross Section shown
in Black Line, Green Dots indicates Project Elements that could Affect Flow Regime
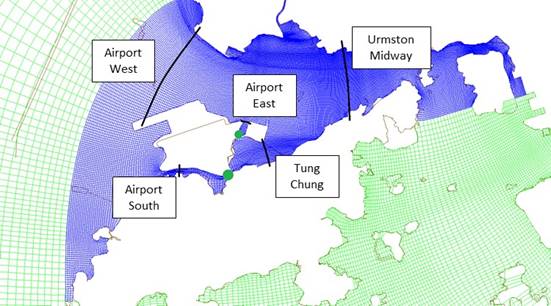
Table 5.11 Predicted
Tidal Discharge across Major Cross Sections
|
Cross Section
|
Tide
Condition
|
Dry
Season
|
Wet
Season
|
|
Scenario
O1
|
Scenario
O2
|
Scenario
O1
|
Scenario
O2
|
|
Average
Discharge (m3 s-1)
|
Average
Discharge (m3 s-1)
|
Change
(m3 s-1)
|
%
Change
|
Average
Discharge (m3 s-1)
|
Average
Discharge (m3 s-1)
|
Change
(m3 s-1)
|
%
Change
|
|
Airport South
|
Flood
|
220
|
218
|
-2
|
-0.9%
|
344
|
342
|
-2
|
-0.6%
|
|
Ebb
|
230
|
231
|
1
|
0.4%
|
294
|
294
|
0
|
0.0%
|
|
Airport West
|
Flood
|
19799
|
19800
|
1
|
0.0%
|
19759
|
19762
|
3
|
0.0%
|
|
Ebb
|
19903
|
19898
|
-5
|
0.0%
|
17152
|
17150
|
-2
|
0.0%
|
|
Tung Chung
|
Flood
|
490
|
484
|
-6
|
-1.2%
|
558
|
555
|
-3
|
-0.5%
|
|
Ebb
|
409
|
409
|
0
|
0.0%
|
389
|
390
|
1
|
0.3%
|
|
Urmston Midway
|
Flood
|
23225
|
23223
|
-2
|
0.0%
|
23645
|
23648
|
3
|
0.0%
|
|
Ebb
|
23307
|
23307
|
0
|
0.0%
|
20511
|
20509
|
-2
|
0.0%
|
|
Airport East
|
Flood
|
55
|
42
|
-13
|
-23.6%
|
28
|
35
|
7
|
25.0%
|
|
Ebb
|
98
|
88
|
-10
|
-10.2%
|
108
|
102
|
-6
|
-5.6%
|
Table 5.12 Predicted
Percentile Distribution of Tidal Discharge across Major Cross Sections (Black:
Scenario O1; Blue: Scenario O2)
|
Location
|
Season
|
Percentile Distribution of Tidal Discharges
|
|
Airport South
(Positive: Flooding; Negative: Ebbing)
|
Dry
|
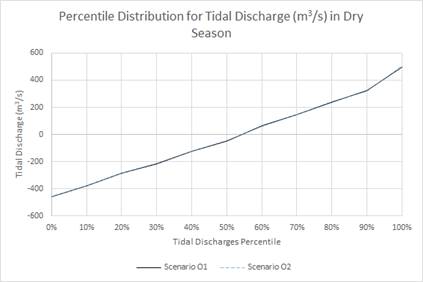
|
|
Wet
|
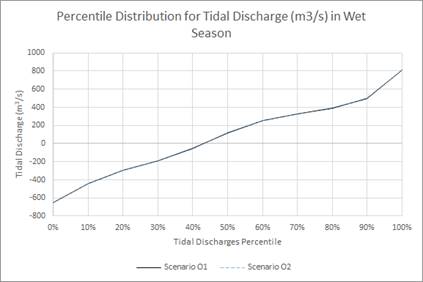
|
|
Airport West
(Positive: Ebbing; Negative: Flooding)
|
Dry
|
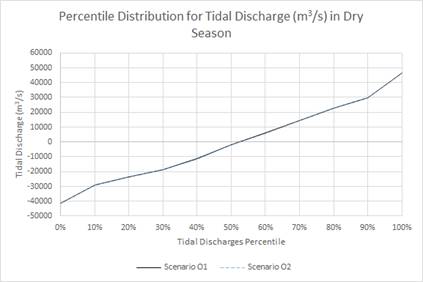
|
|
Wet
|
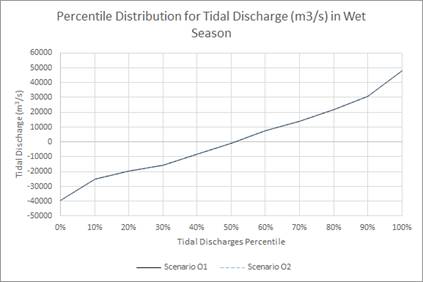
|
|
Tung Chung
(Positive: Flooding; Negative: Ebbing)
|
Dry
|
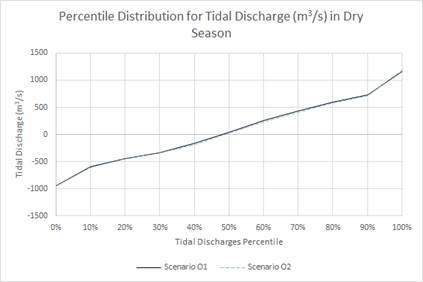
|
|
Wet
|
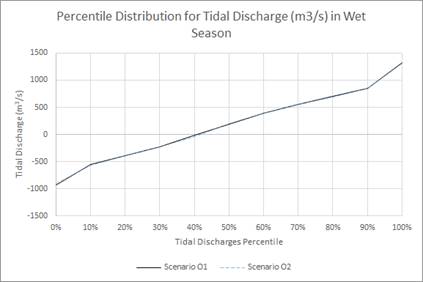
|
|
Urmston Midway (Positive: Flooding; Negative: Ebbing)
|
Dry
|
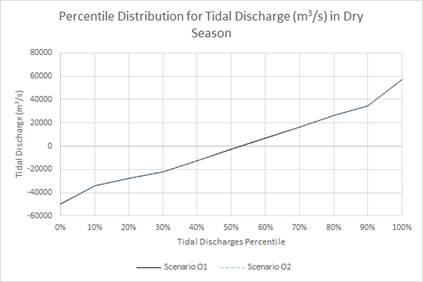
|
|
Wet
|
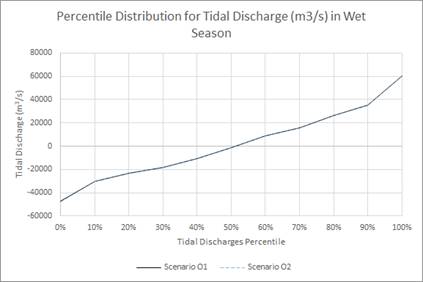
|
|
Airport East
(Positive: Flooding; Negative: Ebbing)
|
Dry
|
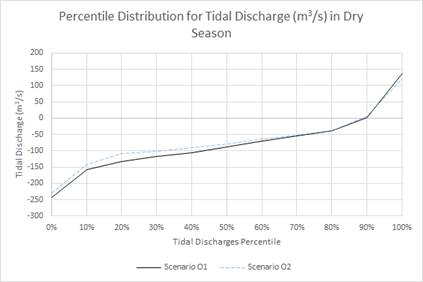
|
|
Wet
|
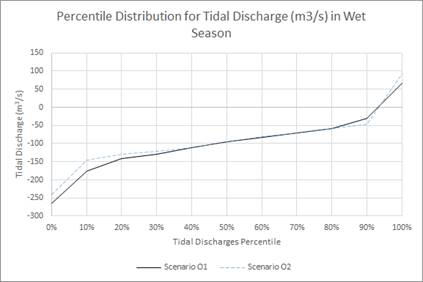
|
Table 5.13 Predicted
Instantaneous Tidal Discharge across Major Cross Section (Black: Scenario O1; Blue:
Scenario O2)
|
Location
|
Season
|
Predicted Instantaneous Tidal Discharges
|
|
Airport South
(Positive: Flooding; Negative: Ebbing)
|
Dry
|
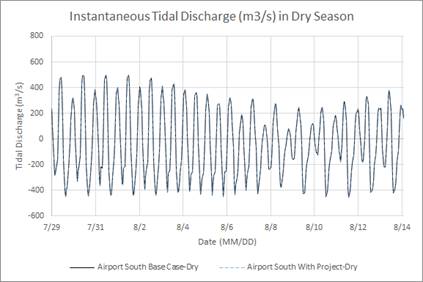
|
|
Wet
|
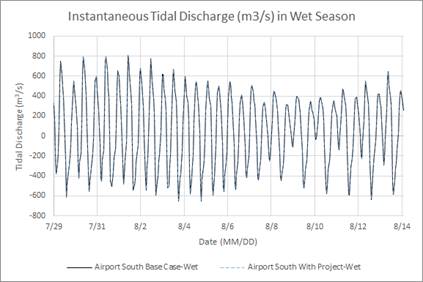
|
|
Airport West
(Positive: Ebbing; Negative: Flooding)
|
Dry
|
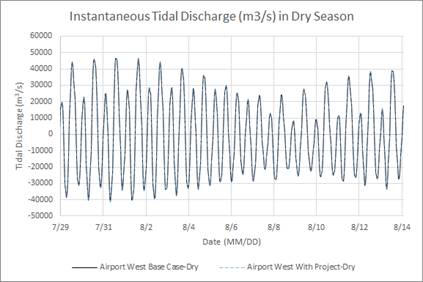
|
|
Wet
|
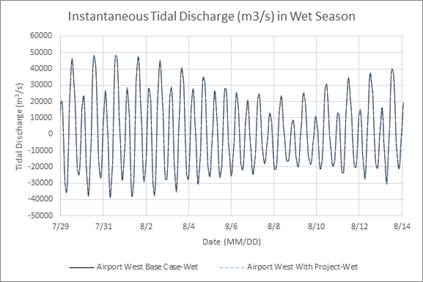
|
|
Tung Chung
(Positive: Flooding; Negative: Ebbing)
|
Dry
|
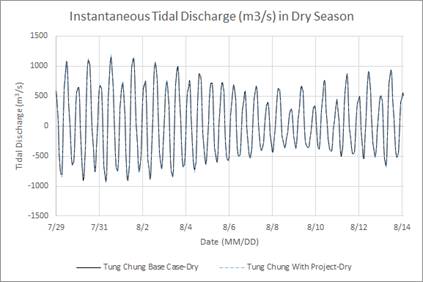
|
|
Wet
|
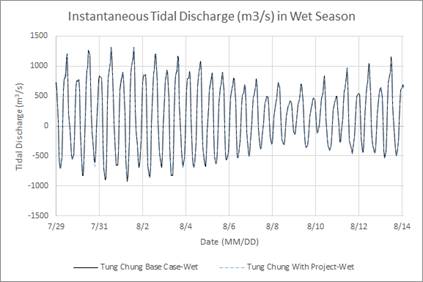
|
|
Urmston Midway (Positive: Flooding; Negative: Ebbing)
|
Dry
|
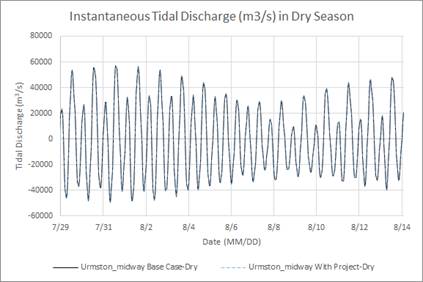
|
|
Wet
|
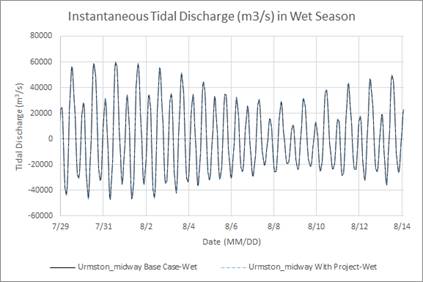
|
|
Airport
East
(Positive:
Flooding; Negative: Ebbing)
|
Dry
|
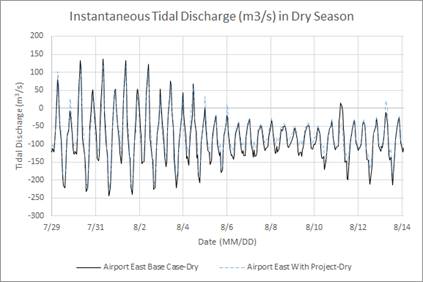
|
|
Wet
|
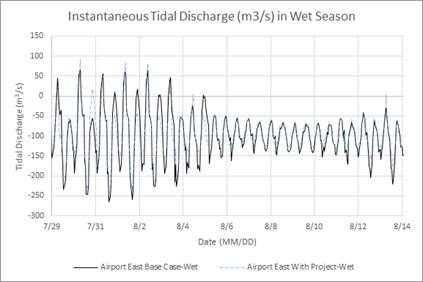
|
Exhibit 5.7 Predicted
Water Temperature (��C) at Seawater Intake C9
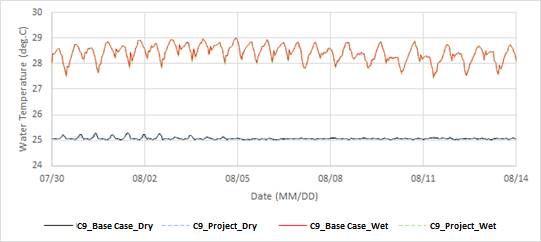
5.8.1.5
To study the changes in the level of material exchange and tidal flushing
of the embayment, an additional assessment has been conducted to investigate the
tidal flushing of the embayment with and without the Project. Water quality modelling scenarios were set
up with initial tracer concentration of 1 mg L-1 within the embayment,
and at 0 mg L-1 at the rest of
the model domain at the start of the model. Tracer would be set for baseline and project
scenarios for a combination of high water / low water / flood tide / ebb tide under
spring / neap tide in both dry / wet seasons (i.e. totalled 32 scenarios).
5.8.1.6
Contour plots showing snapshots of instantaneous tracer
concentration at 0 hr, 1 hr, 2 hr, 4 hr, 8 hr, 12 hr, 16 hr, 24 hr, 36 hr and
48 hr for all modelled scenarios are provided in Appendix 5.4. As shown, it
is quite typical the clearance of tracer at the outer part of the embayment
(with respect to the proposed wave attenuator under this Project) is slightly
faster under the Project Scenario than that of the Baseline Scenario. It is because the presence of the
proposed wave attenuator ��cut off�� the innermost part of the embayment, so the
average distance for the conservative tracer to travel out of the embayment is
effectively reduced and this allows a slightly shorter time of clearance. On the other hand, the clearance of
tracer behind the proposed wave attenuator is typically slower in the Project
Scenario than that of Baseline Scenario which indicated a reduction of flushing
capacity and material exchange behind the wave attenuator. Given no discharge of sewage or other
wastewater into the sea would be allowed within the area of the marine
facilities (), the
accumulation of pollutants as a result of reduced flushing is not anticipated. Regular cleaning and removal of floating
refuses within the area of the marine facilities would be required to ensure no
accumulation of floating refuse around the area of the marine facilities. Overall, the tracer dispersion modelling
exercise indicated the reduced flushing and material exchange behind the
proposed wave attenuator but the potential risk is deemed manageable by
provision of regular clean and removal of floating refuse, and thus deterioration
of water quality within the embayment as a result of change in flow regime is not
anticipated.
5.8.1.7
The tidal discharge analysis demonstrated the limited impact on flow
regime for the entirety of the western waters, while the tracer dispersion assessment
illustrated limited change in tidal flushing within the embayment where the berthing
facilities will be located. To further
demonstrate the limited extent of change in flow regime outside of the embayment,
additional time series plots of current directions and velocity at the nearest
WSRs outside of the embayment under baseline and project scenarios are presented
in Table 5.14 and Table 5.15. Locations of these selected WSRs are shown
in Exhibit 5.8. As shown, the differences predicted under
the two scenarios are minor. Both the
magnitude and direction of tidal current under both baseline and project scenarios
matched well and showed no significant change. This demonstrated the change in flow regime
is highly localized and is not expected to be significant outside of the embayment
and at the nearby WSRs. Potential
change at WSRs further away is expected to be even less significant. Therefore, it is concluded that the change
in flow regime beyond the Project would be limited and will not affect any nearby
WSRs.
Exhibit 5.8 Selected
Representative Locations for Nearby WSRs outside the Embayment
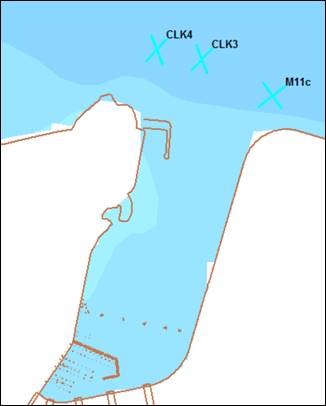
Table 5.14 Current
Magnitude at Observation Points outside the Embayment in Dry Season and Wet Season
|
Location
|
Season
|
Current Magnitude in Baseline and Project Scenario
|
|
CLK4
|
Dry
|
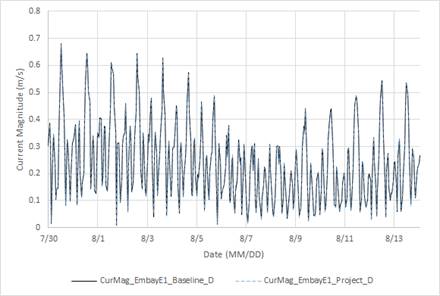
|
|
Wet
|
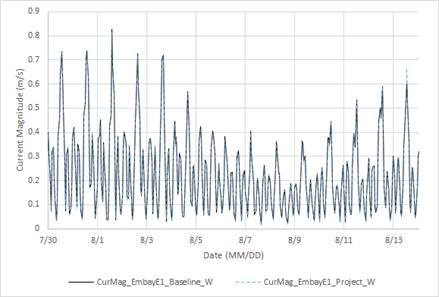
|
|
CLK3
|
Dry
|
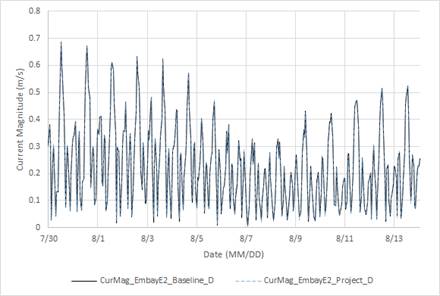
|
|
Wet
|
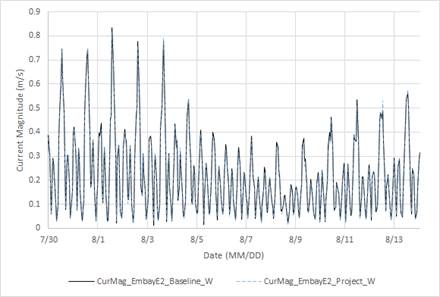
|
|
M11c
|
Dry
|
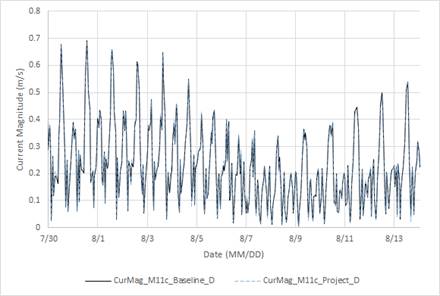
|
|
Wet
|
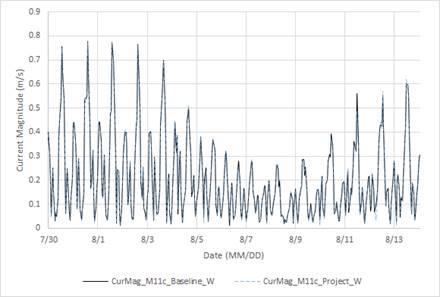
|
Table 5.15 Current
Direction at Additional Observation Points outside the Embayment in Dry Season and
Wet Season
|
Location
|
Season
|
Current Direction in Baseline and Project Scenario
|
|
CLK4
|
Dry
|
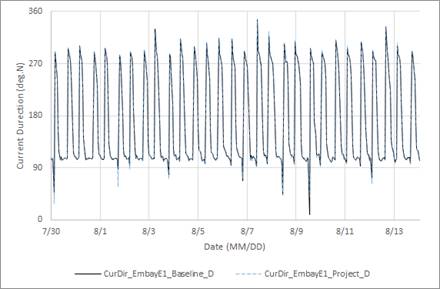
|
|
Wet
|
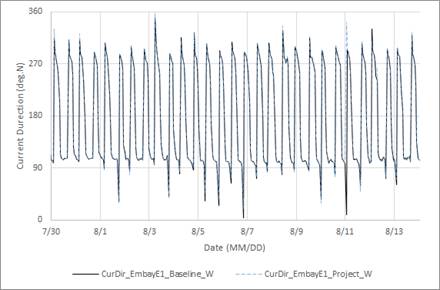
|
|
CLK3
|
Dry
|
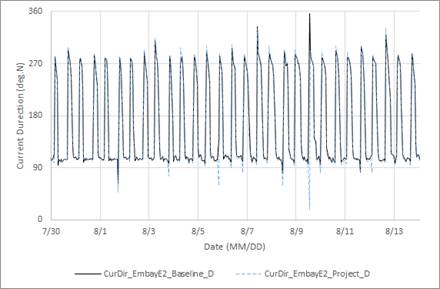
|
|
Wet
|
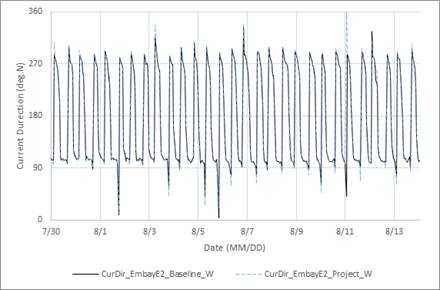
|
|
M11c
|
Dry
|
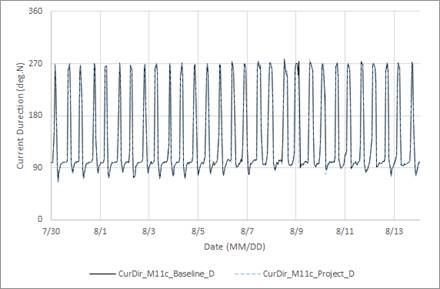
|
|
Wet
|
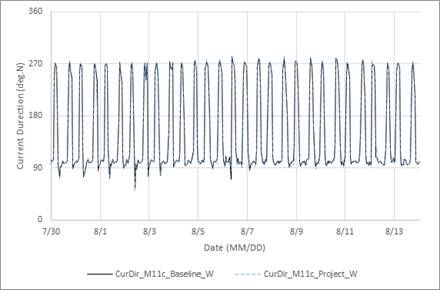
|
5.8.2
SS Elevation and
Increased Sedimentation due to Maintenance Dredging
5.8.2.1
Maintenance dredging within the area of the proposed marine facilities
would be required regularly to maintain safe navigable water depth close to the
existing seabed level. Maintenance
dredging will be carried out in every two years. While the detailed design of such dredging
works was still being investigated when this report was being prepared, the potential
water quality impact from such maintenance dredging operation has been studied through
the use of 3D computational modelling with Delft3D. The selection of model, modelling assumptions,
scenarios and other technical details were detailed in Appendix 5.1 for agreement
with EPD. Based on the latest available
engineering information, a maintenance dredging scenario was conducted based on
the work rate of 40 m3 hr-1 by a single dredger with closed
grab working close to the nearest WSR C14 and with cage type silt curtain installed
at the source. This was modelled to
determine the environmental acceptability of dredging at the prescribed rate. A loss reduction factor of 80% was adopted
for cage type silt curtain in the nearby approved EIA of the Hong Kong - Zhuhai
- Macao Bridge Hong Kong Boundary Crossing Facilities (AEIAR-145/2009) and same
factor was adopted for this Project.
Corresponding sediment loss rate was estimated below and adopted for the
modelling analysis:
Sediment Loss Rate (kg s-1)
= Dredging Rate (m3 s-1) �� Sediment Loss
Rate (kg m-3) �� Silt Curtain Efficiency
= 0.01111 m3 s-1 �� 20 kg m-3 ��
(100% - 80%)
= 0.04444 kg s-1
5.8.2.2
Predicted SS elevation at identified WSRs were presented at Table 5.16. Contour plot showing
the instantaneous SS elevation for maintenance dredging under dry and wet seasons
are provided in Appendix 5.2.
5.8.2.3
The predicted SS elevation was confined to WSRs close to the sediment
source, with no notable elevation outside of the embayment between the HKP and the
Airport Island. Maximum SS elevation
was predicted at the nearest WSR C14 and would be up to 5.31 mg L-1 in
dry season and 4.60 mg L-1 in wet season, which are below the proposed
assessment criteria based on WQO. The
second most impacted WSR was C9, which was also the second closest WSR. The predicted level of SS elevation would
be up to 0.15 mg L-1 in dry season and 0.22 mg L-1 in wet
season. SS elevation at WSRs beyond
was limited and would be below 0.10 mg L-1 in general, which was much
lower than the ambient level as well as the proposed assessment criterion.
5.8.2.4
The predicted levels of sedimentation at identified coral / artificial
reef WSRs were expected to be limited.
Contour plot showing the maximum sedimentation flux for maintenance dredging
under dry and wet seasons are provided in Appendix 5.2. Model prediction for
maximum sedimentation flux at identified coral / artificial reef WSRs are provided
in Table 5.17. Maximum sedimentation
flux was predicted at CR2 and is only up to 0.05 g m-2 day-1,
which is below the corresponding assessment criterion of 200 g m-2 day-1. No additional mitigation measure is deemed
necessary to further reduce sedimentation impact to the nearby WSRs.
Table 5.16 Predicted
Level of SS Elevation (mg L-1) from Maintenance Dredging (Dredging
Rate of 40 m3 hr-1 with a Single Dredger with Closed Grab
close to WSR C14, and with Cage Type Silt Curtain at Source)
|
Description
|
Location
|
Model
Output Location
|
EPD
Station
|
Relevant
Depth
|
Dry
Season
|
Wet
Season
|
|
Ambient
Level
|
WQO
SS Allowable Change
|
Predicted
Max Increase
|
Compliance
Time %
|
Ambient
Level
|
WQO
SS Allowable Change
|
Predicted
Max Increase
|
Compliance
Time %
|
|
Fisheries Sensitive Receivers
|
|
Spawning Grounds for commercial fisheries
resources
|
Spawning Grounds for commercial fisheries
resources in North Lantau
|
F1
|
NM6
|
Depth-averaged
|
28.7
|
8.6
|
<0.01
|
100%
|
17.2
|
5.2
|
<0.01
|
100%
|
|
Marine Ecological Sensitive Receivers
|
|
Marine Park
|
Sha Chau and Lung Kwu Chau Marine Park
|
E1
|
NM6
|
Depth-averaged
|
28.7
|
8.6
|
<0.01
|
100%
|
17.2
|
5.2
|
<0.01
|
100%
|
|
Marine Park
|
The Brothers Marine Park
|
E2
|
NM2
|
Depth-averaged
|
19.7
|
5.9
|
<0.01
|
100%
|
13.3
|
4.0
|
<0.01
|
100%
|
|
SSSI
|
Tai Ho Bay and Tai Ho Stream SSSI
|
E4
|
NM2
|
Depth-averaged
|
19.7
|
5.9
|
<0.01
|
100%
|
13.3
|
4.0
|
<0.01
|
100%
|
|
SSSI
|
Tung Chung Bay and San Tau Beach SSSI
|
E5
|
NM8
|
Depth-averaged
|
42.0
|
12.6
|
<0.01
|
100%
|
23.8
|
7.1
|
<0.01
|
100%
|
|
Horseshoe Crab Habitat
|
Hau
Hok Wan
|
E6
|
NM8
|
Depth-averaged
|
42.0
|
12.6
|
<0.01
|
100%
|
23.8
|
7.1
|
<0.01
|
100%
|
|
Horseshoe Crab Habitat
|
Sha Lo Wan
|
E7
|
NM8
|
Depth-averaged
|
42.0
|
12.6
|
<0.01
|
100%
|
23.8
|
7.1
|
<0.01
|
100%
|
|
Horseshoe Crab Habitat, Mangrove Stand
|
Sham Wat Wan
|
E8
|
NM8
|
Depth-averaged
|
42.0
|
12.6
|
<0.01
|
100%
|
23.8
|
7.1
|
<0.01
|
100%
|
|
Horseshoe Crab Habitat, Mangrove Stand
|
Yam O Wan
|
E9
|
NM1
|
Depth-averaged
|
17.3
|
5.2
|
<0.01
|
100%
|
14.9
|
4.5
|
<0.01
|
100%
|
|
Artificial Reef and Coral Communities
|
Sha Chau and Lung Kwu Chau Marine Park
|
CR1
|
NM6
|
Bottom
|
30.0
|
9.0
|
<0.01
|
100%
|
17.7
|
5.3
|
<0.01
|
100%
|
|
Coral Communities
|
The Brothers Islands (West Brother)
|
CR2
|
NM3
|
Bottom
|
22.8
|
6.8
|
<0.01
|
100%
|
19.6
|
5.9
|
<0.01
|
100%
|
|
Coral Communities
|
North of Sheung Sha Chau
|
CR3
|
NM6
|
Bottom
|
30.0
|
9.0
|
<0.01
|
100%
|
17.7
|
5.3
|
<0.01
|
100%
|
|
Coral Communities
|
Sham Shui Kok
|
CR4
|
NM2
|
Bottom
|
28.0
|
8.4
|
<0.01
|
100%
|
19.1
|
5.7
|
<0.01
|
100%
|
|
Artificial Reef
|
HKIA Approach Area
|
CLK1
|
NM3
|
Bottom
|
22.8
|
6.8
|
<0.01
|
100%
|
19.6
|
5.9
|
<0.01
|
100%
|
|
Artificial Reef
|
HKIA Approach Area
|
CLK2
|
NM3
|
Bottom
|
22.8
|
6.8
|
<0.01
|
100%
|
19.6
|
5.9
|
<0.01
|
100%
|
|
Artificial Reef
|
HKIA Approach Area
|
CLK3
|
NM3
|
Bottom
|
22.8
|
6.8
|
0.01
|
100%
|
19.6
|
5.9
|
<0.01
|
100%
|
|
Artificial Reef
|
HKIA Approach Area
|
CLK4
|
NM3
|
Bottom
|
22.8
|
6.8
|
0.02
|
100%
|
19.6
|
5.9
|
<0.01
|
100%
|
|
Artificial Reef
|
HKIA Approach Area
|
CLK5
|
NM3
|
Bottom
|
22.8
|
6.8
|
<0.01
|
100%
|
19.6
|
5.9
|
<0.01
|
100%
|
|
Water Sensitive Receivers
|
|
Non-gazetted beach
|
Lung Kwu Sheung Tan
|
B1
|
NM5
|
Depth-averaged
|
22.3
|
6.7
|
<0.01
|
100%
|
19.6
|
5.9
|
<0.01
|
100%
|
|
Non-gazetted beach
|
Lung Tsai / Lung Kwu Tan
|
B2
|
NM5
|
Depth-averaged
|
22.3
|
6.7
|
<0.01
|
100%
|
19.6
|
5.9
|
<0.01
|
100%
|
|
Gazetted Beach
|
Butterfly Beach
|
B3
|
NM2
|
Depth-averaged
|
19.7
|
5.9
|
<0.01
|
100%
|
13.3
|
4.0
|
<0.01
|
100%
|
|
Gazetted Beach
|
Cafeteria New Beach
|
B4
|
NM2
|
Depth-averaged
|
19.7
|
5.9
|
<0.01
|
100%
|
13.3
|
4.0
|
<0.01
|
100%
|
|
Gazetted Beach
|
Gold Coast Marina / Golden Beach
|
B5
|
NM2
|
Depth-averaged
|
19.7
|
5.9
|
<0.01
|
100%
|
13.3
|
4.0
|
<0.01
|
100%
|
|
Gazetted Beach
|
Castle Peak Beach
|
B6
|
NM2
|
Depth-averaged
|
19.7
|
5.9
|
<0.01
|
100%
|
13.3
|
4.0
|
<0.01
|
100%
|
|
Gazetted Beach
|
Kadoorie Beach
|
B7
|
NM2
|
Depth-averaged
|
19.7
|
5.9
|
<0.01
|
100%
|
13.3
|
4.0
|
<0.01
|
100%
|
|
Gazetted Beach
|
Cafeteria Old Beach
|
B8
|
NM2
|
Depth-averaged
|
19.7
|
5.9
|
<0.01
|
100%
|
13.3
|
4.0
|
<0.01
|
100%
|
|
Seawater Intake
|
Castle Peak Power Station Cooling Water Intake
|
C1
|
NM5
|
Depth-averaged
|
22.3
|
6.7
|
<0.01
|
100%
|
19.6
|
5.9
|
<0.01
|
100%
|
|
Seawater Intake
|
Cooling Water Intake for Shiu
Wing Steel Mills
|
C2
|
NM3
|
Depth-averaged
|
20.0
|
6.0
|
<0.01
|
100%
|
15.7
|
4.7
|
<0.01
|
100%
|
|
Seawater Intake
|
WSD Seawater Intake at Tuen
Mun (b)
|
C3
|
NM2
|
Depth-averaged
|
19.7
|
5.9
|
<0.01
|
100%
|
13.3
|
4.0
|
<0.01
|
100%
|
|
Seawater Intake
|
Proposed Lok On Pai Intake (Pumping Station)
|
C4
|
NM2
|
Depth-averaged
|
19.7
|
5.9
|
<0.01
|
100%
|
13.3
|
4.0
|
<0.01
|
100%
|
|
Seawater Intake
|
Future Seawater Intake Point for Sunny Bay
|
C5
|
NM1
|
Depth-averaged
|
17.3
|
5.2
|
<0.01
|
100%
|
14.9
|
4.5
|
<0.01
|
100%
|
|
Seawater Intake
|
Proposed Ta Pang Po Intake (Pumping Station)
|
C6
|
NM1
|
Depth-averaged
|
17.3
|
5.2
|
<0.01
|
100%
|
14.9
|
4.5
|
<0.01
|
100%
|
|
Seawater Intake
|
Future Seawater Intake Point for Tung Chung East
|
C8
|
NM3
|
Depth-averaged
|
20.0
|
6.0
|
<0.01
|
100%
|
15.7
|
4.7
|
<0.01
|
100%
|
|
Seawater Intake
|
HKP Intake
|
C9
|
NM3
|
Depth-averaged
|
20.0
|
6.0
|
0.15
|
100%
|
15.7
|
4.7
|
0.22
|
100%
|
|
Seawater Intake
|
Cooling Water Intake at HKIA North
|
C10
|
NM3
|
Depth-averaged
|
20.0
|
6.0
|
0.01
|
100%
|
15.7
|
4.7
|
0.02
|
100%
|
|
Seawater Intake
|
Future Seawater Intake at HKIA East
|
C11
|
NM3
|
Depth-averaged
|
20.0
|
6.0
|
<0.01
|
100%
|
15.7
|
4.7
|
<0.01
|
100%
|
|
Seawater Intake
|
Seawater Intake at Tung Chung
|
C12
|
NM3
|
Depth-averaged
|
20.0
|
6.0
|
<0.01
|
100%
|
15.7
|
4.7
|
<0.01
|
100%
|
|
Seawater Intake
|
Cooling Water Intake at HKIA South
|
C13
|
NM8
|
Depth-averaged
|
42.0
|
12.6
|
<0.01
|
100%
|
23.8
|
7.1
|
<0.01
|
100%
|
|
Seawater Intake
|
Cooling Seawater Intake Point for SKYCITY
|
C14
|
NM3
|
Depth-averaged
|
20.0
|
6.0
|
5.31
|
100%
|
15.7
|
4.7
|
4.60
|
100%
|
|
Seawater Intake
|
LRT Tuen Mun Ferry Pier
Terminus
|
C15
|
NM2
|
Depth-averaged
|
19.7
|
5.9
|
<0.01
|
100%
|
13.3
|
4.0
|
<0.01
|
100%
|
|
Seawater Intake
|
Tuen Mun Hospital
|
C16
|
NM2
|
Depth-averaged
|
28.0
|
8.4
|
<0.01
|
100%
|
19.1
|
5.7
|
<0.01
|
100%
|
|
Seawater Intake
|
Sam Shing Estate
|
C17
|
NM2
|
Depth-averaged
|
28.0
|
8.4
|
<0.01
|
100%
|
19.1
|
5.7
|
<0.01
|
100%
|
|
Seawater Intake
|
China Cement Plant
|
C18
|
NM5
|
Depth-averaged
|
22.0
|
6.6
|
<0.01
|
100%
|
36.1
|
10.8
|
<0.01
|
100%
|
|
Typhoon Shelter
|
Tuen
Mun
|
T1
|
NM2
|
Depth-averaged
|
19.7
|
5.9
|
<0.01
|
100%
|
13.3
|
4.0
|
<0.01
|
100%
|
|
Observation Points
|
|
Boundary of Marine Park
|
The Brothers Marine Park
|
M9
|
NM3
|
Depth-averaged
|
20.0
|
6.0
|
<0.01
|
100%
|
15.7
|
4.7
|
<0.01
|
100%
|
|
Boundary of Marine Park
|
Sha Chau and Lung Kwu Chau Marine Park
|
M10a
|
NM5
|
Depth-averaged
|
22.3
|
6.7
|
<0.01
|
100%
|
19.6
|
5.9
|
<0.01
|
100%
|
|
Boundary of Marine Park
|
Sha Chau and Lung Kwu Chau Marine Park
|
M10b
|
NM5
|
Depth-averaged
|
22.3
|
6.7
|
<0.01
|
100%
|
19.6
|
5.9
|
<0.01
|
100%
|
|
Boundary of Marine Park
|
Sha Chau and Lung Kwu Chau Marine Park
|
M10c
|
NM6
|
Depth-averaged
|
28.7
|
8.6
|
<0.01
|
100%
|
17.2
|
5.2
|
<0.01
|
100%
|
|
Boundary of Marine Park
|
Sha Chau and Lung Kwu Chau Marine Park
|
M10d
|
NM6
|
Depth-averaged
|
28.7
|
8.6
|
<0.01
|
100%
|
17.2
|
5.2
|
<0.01
|
100%
|
|
Boundary of Marine Park
|
Sha Chau and Lung Kwu Chau Marine Park
|
M10e
|
NM6
|
Depth-averaged
|
28.7
|
8.6
|
<0.01
|
100%
|
17.2
|
5.2
|
<0.01
|
100%
|
|
Boundary of Marine Park
|
Proposed North Lantau Marine Park
|
M11a
|
NM8
|
Depth-averaged
|
42.0
|
12.6
|
<0.01
|
100%
|
23.8
|
7.1
|
<0.01
|
100%
|
|
Boundary of Marine Park
|
Proposed North Lantau Marine Park
|
M11b
|
NM8
|
Depth-averaged
|
42.0
|
12.6
|
<0.01
|
100%
|
23.8
|
7.1
|
<0.01
|
100%
|
|
Boundary of Marine Park
|
Proposed North Lantau Marine Park
|
M11c
|
NM3
|
Depth-averaged
|
20.0
|
6.0
|
0.01
|
100%
|
15.7
|
4.7
|
0.02
|
100%
|
Table 5.17 Predicted
Level of Sedimentation (g/m2/day) at Coral and Artificial Reef from
Maintenance Dredging (Dredging Rate of 40 m3 hr-1 with
One Single Dredger with Closed Grab close to WSR C14, and with Cage Type Silt
Curtain at Source)
|
Description
|
Location
|
Model Output Location
|
Assessment
Criterion
|
Model Prediction
|
|
Dry
Season
|
Wet
Season
|
|
Artificial Reef and coral communities
|
Sha Chau and Lung Kwu Chau Marine Park
|
CR1
|
200
|
<1
|
<1
|
|
Coral communities
|
The Brothers Islands (West Brother)
|
CR2
|
200
|
<1
|
<1
|
|
Coral communities
|
North of Sheung Sha Chau
|
CR3
|
200
|
<1
|
<1
|
|
Coral communities
|
Sham Shui Kok
|
CR4
|
200
|
<1
|
<1
|
5.8.3
Dissolved Oxygen
(DO) Depletion due to Maintenance Dredging
5.8.3.1 The degree of
DO depletion exerted by a sediment plume is a function of the sediment oxygen demand
of the sediment, its concentration in the water column and the rate of oxygen replenishment. The impact of the sediment oxygen demand
on DO concentrations has been calculated based on the following equation:
DO (mg O2 L-1) = DO (g O2 m-3)
= SS (g DW m-3) �� sediment oxygen demand (g O2 g-1
DW)
5.8.3.2 Review of sediment
quality data from the nearest EPD Sediment Quality Monitoring Station indicated
maximum sediment oxygen demand of up to 17,000 mg kg-1. Predicted DO depletion at identified WSRs
were presented at Table 5.18. Based on the predicted maximum SS elevation
of 5.31 mg L-1 under the modelled scenario, the maximum level of DO depletion
would be up to 0.09 mg L-1, which is below the corresponding allowable
DO depletion levels of 0.4 mg L-1. Other WSRs at further distance were predicted
to have much lower SS elevation, and thus would experience proportionally lower
DO depletion. No unacceptable level
of DO depletion is expected from the proposed maintenance dredging.
Table 5.18 Predicted
Level of DO Depletion (mg L-1) (Dredging Rate of 40 m3 hr-1
with One Single Dredger with Closed Grab close to WSR C14, and with Cage Type
Silt Curtain at Source)
|
Description
|
Location
|
Model Output Location
|
EPD Station
|
Relevant Depth
|
Predicted Max SS Increase
|
Predict Max DO Depletion
|
WQO DO Allowable Change
|
|
Dry Season
|
Wet Season
|
Dry Season
|
Wet Season
|
|
Fisheries
Sensitive Receivers
|
|
Spawning
Grounds for commercial fisheries resources
|
Spawning
Grounds for commercial fisheries resources in North Lantau
|
F1
|
NM6
|
Depth-averaged
|
<0.01
|
<0.01
|
<0.01
|
<0.01
|
0.7
|
|
Marine
Ecological Sensitive Receivers
|
|
Marine Park
|
Sha Chau
and Lung Kwu Chau Marine Park
|
E1
|
NM6
|
Depth-averaged
|
<0.01
|
<0.01
|
<0.01
|
<0.01
|
0.7
|
|
Marine Park
|
The
Brothers Marine Park
|
E2
|
NM2
|
Depth-averaged
|
<0.01
|
<0.01
|
<0.01
|
<0.01
|
0.5
|
|
SSSI
|
Tai Ho Bay
and Tai Ho Stream SSSI
|
E4
|
NM2
|
Depth-averaged
|
<0.01
|
<0.01
|
<0.01
|
<0.01
|
0.5
|
|
SSSI
|
Tung Chung
Bay and San Tau Beach SSSI
|
E5
|
NM8
|
Depth-averaged
|
<0.01
|
<0.01
|
<0.01
|
<0.01
|
0.6
|
|
Horseshoe
Crab Habitat
|
Hau Hok Wan
|
E6
|
NM8
|
Depth-averaged
|
<0.01
|
<0.01
|
<0.01
|
<0.01
|
0.6
|
|
Horseshoe
Crab Habitat
|
Sha Lo Wan
|
E7
|
NM8
|
Depth-averaged
|
<0.01
|
<0.01
|
<0.01
|
<0.01
|
0.6
|
|
Horseshoe
Crab Habitat, Mangrove Stand
|
Sham Wat
Wan
|
E8
|
NM8
|
Depth-averaged
|
<0.01
|
<0.01
|
<0.01
|
<0.01
|
0.6
|
|
Horseshoe
Crab Habitat, Mangrove Stand
|
Yam O Wan
|
E9
|
NM1
|
Depth-averaged
|
<0.01
|
<0.01
|
<0.01
|
<0.01
|
0.2
|
|
Artificial
Reef and coral Communities
|
Sha Chau
and Lung Kwu Chau Marine Park
|
CR1
|
NM6
|
Bottom
|
<0.01
|
<0.01
|
<0.01
|
<0.01
|
2.5
|
|
Coral
Communities
|
The
Brothers Islands (West Brother)
|
CR2
|
NM3
|
Bottom
|
<0.01
|
<0.01
|
<0.01
|
<0.01
|
1.5
|
|
Coral
Communities
|
North of
Sheung Sha Chau
|
CR3
|
NM6
|
Bottom
|
<0.01
|
<0.01
|
<0.01
|
<0.01
|
2.5
|
|
Coral
Communities
|
Sham Shui Kok
|
CR4
|
NM2
|
Bottom
|
<0.01
|
<0.01
|
<0.01
|
<0.01
|
1.7
|
|
Artificial
Reef
|
HKIA
Approach Area
|
CLK1
|
NM3
|
Bottom
|
<0.01
|
<0.01
|
<0.01
|
<0.01
|
1.5
|
|
Artificial
Reef
|
HKIA
Approach Area
|
CLK2
|
NM3
|
Bottom
|
<0.01
|
<0.01
|
<0.01
|
<0.01
|
1.5
|
|
Artificial
Reef
|
HKIA
Approach Area
|
CLK3
|
NM3
|
Bottom
|
0.01
|
0.03
|
<0.01
|
<0.01
|
1.5
|
|
Artificial
Reef
|
HKIA
Approach Area
|
CLK4
|
NM3
|
Bottom
|
0.02
|
0.04
|
<0.01
|
<0.01
|
1.5
|
|
Artificial
Reef
|
HKIA
Approach Area
|
CLK5
|
NM3
|
Bottom
|
<0.01
|
<0.01
|
<0.01
|
<0.01
|
1.5
|
|
Water
Sensitive Receivers
|
|
Non-gazetted
Beach
|
Lung Kwu Sheung Tan
|
B1
|
NM5
|
Depth-averaged
|
<0.01
|
<0.01
|
<0.01
|
<0.01
|
0.2
|
|
Non-gazetted
Beach
|
Lung Tsai /
Lung Kwu Tan
|
B2
|
NM5
|
Depth-averaged
|
<0.01
|
<0.01
|
<0.01
|
<0.01
|
0.2
|
|
Gazetted
Beach
|
Butterfly
Beach
|
B3
|
NM2
|
Depth-averaged
|
<0.01
|
<0.01
|
<0.01
|
<0.01
|
0.5
|
|
Gazetted
Beach
|
Cafeteria
New Beach
|
B4
|
NM2
|
Depth-averaged
|
<0.01
|
<0.01
|
<0.01
|
<0.01
|
0.5
|
|
Gazetted
Beach
|
Gold Coast
Marina / Golden Beach
|
B5
|
NM2
|
Depth-averaged
|
<0.01
|
<0.01
|
<0.01
|
<0.01
|
0.5
|
|
Gazetted
Beach
|
Castle
Peak Beach
|
B6
|
NM2
|
Depth-averaged
|
<0.01
|
<0.01
|
<0.01
|
<0.01
|
0.5
|
|
Gazetted
Beach
|
Kadoorie Beach
|
B7
|
NM2
|
Depth-averaged
|
<0.01
|
<0.01
|
<0.01
|
<0.01
|
0.5
|
|
Gazetted
Beach
|
Cafeteria
Old Beach
|
B8
|
NM2
|
Depth-averaged
|
<0.01
|
<0.01
|
<0.01
|
<0.01
|
0.5
|
|
Seawater
Intake
|
Castle
Peak Power Station Cooling Water Intake
|
C1
|
NM5
|
Depth-averaged
|
<0.01
|
<0.01
|
<0.01
|
<0.01
|
0.2
|
|
Seawater
Intake
|
Cooling
Water Intake for Shiu Wing Steel Mills
|
C2
|
NM3
|
Depth-averaged
|
<0.01
|
<0.01
|
<0.01
|
<0.01
|
0.3
|
|
Seawater
Intake
|
WSD
Seawater Intake at Tuen Mun
|
C3
|
NM2
|
Depth-averaged
|
<0.01
|
<0.01
|
<0.01
|
<0.01
|
2.5
|
|
Seawater
Intake
|
Proposed
Lok On Pai Intake (Pumping Station)
|
C4
|
NM2
|
Depth-averaged
|
<0.01
|
<0.01
|
<0.01
|
<0.01
|
0.5
|
|
Seawater
Intake
|
Future
Seawater Intake Point for Sunny Bay
|
C5
|
NM1
|
Depth-averaged
|
<0.01
|
<0.01
|
<0.01
|
<0.01
|
0.2
|
|
Seawater
Intake
|
Proposed
Ta Pang Po Intake (Pumping Station)
|
C6
|
NM1
|
Depth-averaged
|
<0.01
|
<0.01
|
<0.01
|
<0.01
|
0.2
|
|
Seawater
Intake
|
Future
Seawater Intake Point for Tung Chung East
|
C8
|
NM3
|
Depth-averaged
|
<0.01
|
<0.01
|
<0.01
|
<0.01
|
0.3
|
|
Seawater
Intake
|
HKP
Intake
|
C9
|
NM3
|
Depth-averaged
|
0.15
|
0.22
|
<0.01
|
<0.01
|
0.3
|
|
Seawater
Intake
|
Cooling
Water Intake at HKIA North
|
C10
|
NM3
|
Depth-averaged
|
0.01
|
0.02
|
<0.01
|
<0.01
|
0.3
|
|
Seawater
Intake
|
Future
Seawater Intake at HKIA East
|
C11
|
NM3
|
Depth-averaged
|
<0.01
|
<0.01
|
<0.01
|
<0.01
|
0.3
|
|
Seawater
Intake
|
Seawater
Intake at Tung Chung
|
C12
|
NM3
|
Depth-averaged
|
<0.01
|
<0.01
|
<0.01
|
<0.01
|
0.3
|
|
Seawater
Intake
|
Cooling
Water Intake at HKIA South
|
C13
|
NM8
|
Depth-averaged
|
<0.01
|
<0.01
|
<0.01
|
<0.01
|
0.6
|
|
Seawater
Intake
|
Cooling
Seawater Intake Point for SKYCITY
|
C14
|
NM3
|
Depth-averaged
|
5.31
|
4.60
|
0.09
|
0.08
|
0.3
|
|
Seawater
Intake
|
LRT
Tuen Mun Ferry Pier Terminus
|
C15
|
NM2
|
Depth-averaged
|
<0.01
|
<0.01
|
<0.01
|
<0.01
|
0.5
|
|
Seawater
Intake
|
Tuen Mun Hospital
|
C16
|
NM2
|
Depth-averaged
|
<0.01
|
<0.01
|
<0.01
|
<0.01
|
0.5
|
|
Seawater
Intake
|
Sam
Shing Estate
|
C17
|
NM2
|
Depth-averaged
|
<0.01
|
<0.01
|
<0.01
|
<0.01
|
0.5
|
|
Seawater
Intake
|
China
Cement Plant
|
C18
|
NM5
|
Depth-averaged
|
<0.01
|
<0.01
|
<0.01
|
<0.01
|
0.2
|
|
Typhoon
Shelter
|
Tuen Mun
|
T1
|
NM2
|
Depth-averaged
|
<0.01
|
<0.01
|
<0.01
|
<0.01
|
0.5
|
|
Observation
Points
|
|
Boundary of
Marine Park
|
The
Brothers Marine Park
|
M9
|
NM3
|
Depth-averaged
|
<0.01
|
<0.01
|
<0.01
|
<0.01
|
0.3
|
|
Boundary of
Marine Park
|
Sha Chau
and Lung Kwu Chau Marine Park
|
M10a
|
NM5
|
Depth-averaged
|
<0.01
|
<0.01
|
<0.01
|
<0.01
|
0.2
|
|
Boundary of
Marine Park
|
Sha Chau
and Lung Kwu Chau Marine Park
|
M10b
|
NM5
|
Depth-averaged
|
<0.01
|
<0.01
|
<0.01
|
<0.01
|
0.2
|
|
Boundary of
Marine Park
|
Sha Chau
and Lung Kwu Chau Marine Park
|
M10c
|
NM6
|
Depth-averaged
|
<0.01
|
<0.01
|
<0.01
|
<0.01
|
0.7
|
|
Boundary of
Marine Park
|
Sha Chau
and Lung Kwu Chau Marine Park
|
M10d
|
NM6
|
Depth-averaged
|
<0.01
|
<0.01
|
<0.01
|
<0.01
|
0.7
|
|
Boundary of
Marine Park
|
Sha Chau
and Lung Kwu Chau Marine Park
|
M10e
|
NM6
|
Depth-averaged
|
<0.01
|
<0.01
|
<0.01
|
<0.01
|
0.7
|
|
Boundary of
Marine Park
|
Proposed
North Lantau Marine Park
|
M11a
|
NM8
|
Depth-averaged
|
<0.01
|
<0.01
|
<0.01
|
<0.01
|
0.6
|
|
Boundary of
Marine Park
|
Proposed
North Lantau Marine Park
|
M11b
|
NM8
|
Depth-averaged
|
<0.01
|
<0.01
|
<0.01
|
<0.01
|
0.6
|
|
Boundary of
Marine Park
|
Proposed
North Lantau Marine Park
|
M11c
|
NM3
|
Depth-averaged
|
0.01
|
0.02
|
<0.01
|
<0.01
|
0.3
|
5.8.4
Release of Sediment-bounded
Nutrients due to Maintenance Dredging
5.8.4.1 Disturbance to
sediment due to maintenance dredging could release sediment-bounded nutrients into
the water column, causing an enrichment of nutrient levels in the receiving water. The release of sediment-bounded nutrient
was modelled as release of conservative tracer in Delft3D. The modelled release rate was set to be the
same as the sediment release rate.
5.8.4.2 Review of sediment
quality results under the elutriate test (Appendix 5.7 referred;
summary provided in Table 5.5) indicated some
release on nitrogenous species would be expected from sediment disturbance from
the proposed maintenance dredging.
Maximum release of Total Kjeldahl Nitrogen
(TKN) from elutriate test among all survey locations was adopted for the
assessment of potential elevation of total inorganic nitrogen (TIN) and
unionized ammonia (UIA) nitrogen.
Note that oxidized nitrogen (nitrate and nitrite) tends to be low in
sediment sample because of the reducing environment. The elutriate test results for oxidized
nitrogen are inconsistent and some elutriate has lower oxidized nitrogen level
than that of sea water blank sample, indicating some oxidized nitrogen being
removed (potentially through adsorption).
Therefore, the potential release of sediment-bounded oxidized nitrogen
is not included in the assessment.
Among all stations, the maximum TKN release (elutriate level minus sea
water blank level) was found to be 15.7 mg L-1. Given these 15.7
mg L-1 of TKN was extracted from 1 kg of sediment using 4 L of
seawater, this means about 62.8 mg of TKN could be released from 1 kg of
disturbed sediment. Assuming 100%
of TKN would be converted into TIN immediately after release, this implies a release
rate of 62.8 mg TIN per 1 kg of sediment disturbed, or a percentage of 0.00628%. This 0.00628% ratio would then be applied
to the predicted conservative tracer concentration at WSRs to estimate the predicted
level of TIN elevation at WSRs (i.e. TIN elevation at WSR = conservative tracer
concentration �� 0.00628%). Predicted
level of conservative tracer and corresponding level of TIN and UIA nitrogen are
presented in Table 5.19. Based on the predicted
maximum conservative tracer concentration in dry and wet seasons, the maximum TIN
elevation at the most impacted WSR C14 was 0.0042 mg L-1 which was only
about 0.6% of the ambient levels at the nearest EPD Marine Water Quality Monitoring
Station (NM6, mean levels = 0.69 mg L-1). Given the temporary nature of the impact
and the small change in TIN levels relative to ambient concentrations, the expected
level of TIN elevation at other WSRs were even lower and no unacceptable water quality
impact from TIN elevation is anticipated.
5.8.4.3 Similarly, the
potential increase in UIA at C14 was calculated to be 0.00016 mg L-1,
which was also less than 1% of the allowable elevation (0.017 mg L-1,
based on baseline level of 0.004 mg L-1 as shown in Table 5.2). It is expected that the UIA elevation at
other farther WSRs were even lower and thus no unacceptable water quality impact
from UIA elevation is anticipated. Overall,
no unacceptable change in water quality associated release of sediment-bounded nutrients
from maintenance dredging is expected.
Table 5.19 Predicted
Level of Conservative Tracer (mg L-1) and Corresponding Level of TIN
and UIA at WSR C14 from Maintenance Dredging (Dredging Rate of 40 m3
hr-1 with One Close Grab Dredger close to WSR C14, and with Cage Type
Silt Curtain at Source)
|
Description
|
Location
|
Model
Output Location
|
EPD Station
|
Predicted
Maximum Conservative Tracer Concentration
(mg
L-1)
|
Predicted Maximum Elevation (mg
L-1)
|
|
Dry Season
(a)
|
Wet Season
(b)
|
Total Inorganic Nitrogen
(c)=Max((a),(b))��0.00628%
|
Unionized Ammonia Nitrogen
(d)=(c)�� 3.7%
|
|
Seawater
Intake
|
Cooling
Seawater Intake Point for SKYCITY
|
C14
|
NM3
|
67.03100
|
39.42700
|
4.2E-03
|
1.6E-04
|
5.8.5
Release of Sediment-bounded
Contaminants due to Maintenance Dredging
5.8.5.1 Review of the
sediment quality results under elutriate test detailed in Section 5.3.4.1 suggested that there would not be observable release
of contaminants from sediment to marine water for all heavy metals and organic contaminants
of concern except for arsenic and nickel.
In view of this, arsenic and nickel level increase at the nearest WSRs due
to the maintenance dredging were estimated.
5.8.5.2 Increase of arsenic
and nickel levels at the nearest WSRs, WSR C14 (seawater intake) and the closest
marine ecological sensitive receiver, WSR M11c (boundary of the proposed North Lantau
Marine Park). Note that WSR C14 is not
known to be sensitive to heavy metals and organic contaminants but its data was
presented as worst case scenario due to its proximity. As shown in Table 5.20, the predicted
maximum arsenic and nickel levels at both WSRs were below the assessment criteria and no exceedance on contaminants level would
observe at other WSRs that farther away from the project area. No unacceptable levels of sediment-bounded
nutrients and contaminants from maintenance dredging is predicted.
Table 5.20 Estimation
of Contaminant Levels Elevation at the Most Impacted WSRs from Maintenance
Dredging
|
Parameters
|
Elutriate Elevation
|
Mass Release Rate
(a)
|
Maximum Tracer Conc. (mg L-1) in Dry Season and
Wet Season at C14
(b)
|
Contaminant Concentration (µg L-1)
(c)= (a)/1000x(b)/1000
|
Maximum Tracer Conc. (mg L-1) in Dry Season and
Wet Season at M11c
(d)
|
Contaminant Concentration (µg L-1)
(e)= (a)/1000x(d)/1000
|
Assessment Criteria (µg L-1)
|
|
Arsenic
|
50.00
|
200.00
|
67.03100
|
1.3E-02
|
0.00093
|
1.9E-07
|
13
|
|
Nickel
|
0.20
|
0.80
|
5.4E-05
|
7.5E-10
|
70
|
5.8.6
Generation of Wastewater, Sewage from Staff, Visitors etc.
5.8.6.1
Sewage effluent and wastewater would be generated from staff and
visitors. Local connections to the existing
sewer within the Airport Island would be installed and no direct discharge of sewage
and wastewater to the nearby drainage system and marine waters would be expected. Review of existing sewerage system
indicated capacity is sufficient in view of the limited sewage generation (0.0609
m3/s) from this Project.
5.8.6.2
Depot operation typically involve parking, charging and cleaning
of zero emission vehicles. Cleaning
of zero emission vehicles generally involve only soap and water, which is
typical safe for disposal to sewer.
The maintenance wastewater collection system will be separated from the
public sewer. Routine maintenance
may involve release oil and grease residues. Related wastewater will be properly
collected, for treatment and disposal off-site by licensed contractor as well.
5.8.6.3
Marine facilities which include a pier and berthing facilities would
serve strictly for berthing purposes only and thus sewage discharge is not anticipated. In addition, discharge from marine facilities
were controlled under the Water Pollution
Control Ordinance and discharge from vessels were controlled under both Water Pollution Control Ordinance and Merchant Shipping (Prevention and Control of
Pollution) Ordinance.
5.8.7
Potential Oil Spillage associated
with the Operation of the Vessels
5.8.7.1
During the operational phase, the operation of the marine vessels would
carry risk of spillage. In general,
marine vessel speed at or around the area of marine facilities would be low and
therefore the risk of collision would be low as well. Equipment for spillage clean-up such as floating
booms would be stored on the marine facilities to facilitate quick response on clean-up
effort. The sheltered environment of
the marine facilities also would limit the potential spread and allow containment
and timely clean-up be conducted easily.
No unacceptable water quality impact from oil spillage
from the operation of vessels within the marine facilities would be expected.
5.8.8
Generation
of Road Runoff
5.8.8.1
Road runoff discharge from viaducts and at-grade sections would be
arise during operational phase. The
discharge would contain small amount of suspended
solids and oil/grease that may cause water quality impacts to the nearby
receiving marine water. A proper drainage system will be provided to receive the
surface runoff to the drainage system at the planning and design stages. No new stormwater discharge outfall under this Project would be
located within the marine
facilities. Unacceptable adverse water quality
impact associated with the operation of marine facilities is not
anticipated. No unacceptable water quality impact from road runoff would
be expected.
5.9.1
Construction Phase
5.9.1.1 The following
standard measures and good site practices are recommended to be implemented to avoid/minimise
the potential impacts from marine-based and land-based construction activities:
��
There will be at most 2 piles installed concurrently for the
marine facilities. Similarly, there
will be at most 2 piles installed concurrently for the marine viaduct.
��
Silt curtain would be set up to enclose the entire active work
area before commencement of piling works for marine facilities and marine
viaduct to control sediment dispersion.
��
All vessels should be well maintained and inspected before use
to limit any potential discharges to the marine environment.
��
All vessels must have a clean ballast system.
��
All vessels shall be sized such that adequate clearance is maintained
between vessels and the sea bed at all states of the tide to ensure that undue turbidity
is not generated by turbulence from vessel movement or propeller wash.
��
Marine works shall not cause foam, oil, grease, litter or other
objectionable matter to be present in the water within and adjacent to the works
site. Wastewater from potentially contaminated
area on working vessels should be minimized and collected. These kinds of wastewater
should be brought back to port and discharged at appropriate collection and treatment
system.
��
No solid waste is allowed
to be disposed overboard.
��
Best Management Practices (BMPs) of mitigation measures
in controlling water pollution and good site management, as specified in the ProPECC PN 1/94 ��Construction
Site Drainage�� are followed, where applicable, to prevent runoff with high level
of SS from entering the surrounding waters.
��
At the start of site establishment, perimeter cut-off drains
to direct off-site water around the site should be constructed with internal drainage
works. Channels, earth bunds or sand
bag barriers should be provided on site to direct stormwater
to silt removal facilities.
��
Diversion of natural stormwater
should be provided as far as possible.
The design of temporary on-site drainage should prevent runoff going through
site surface, construction machinery and equipment in order to avoid or minimize
polluted runoff. Sedimentation tanks
with sufficient capacity, constructed from pre-formed individual cells of approximately
6 to 8 m3 capacities, are recommended as a general mitigation measure
which can be used for settling surface runoff prior to disposal. The system capacity shall be flexible and
able to handle multiple inputs from a variety of sources and suited to applications
where the influent is pumped.
��
The dikes or embankments for flood protection should be
implemented around the boundaries of earthwork areas. Temporary ditches should be provided to facilitate
the runoff discharge into an appropriate watercourse, through a silt/sediment trap. The silt/sediment traps should be incorporated
in the permanent drainage channels to enhance deposition rates.
��
The design of efficient silt removal facilities should
be based on the guidelines in Appendix A1 of ProPECC PN 1/94. The detailed design of the sand/silt traps
should be undertaken by the contractor prior to the commencement of construction.
��
All drainage facilities and erosion and sediment control
structures should be regularly inspected and maintained to ensure proper and efficient
operation at all times and particularly following rainstorms. Deposited silt and grit should be removed
regularly and disposed of by spreading evenly over stable, vegetated areas.
��
All open stockpiles of construction materials (for example,
aggregates, sand and fill material) should be covered with tarpaulin or similar
fabric during rainstorms. Measures should
be taken to prevent the washing away of construction materials, soil, silt or debris
into any drainage system.
��
Manholes (including newly constructed ones) should always
be adequately covered and temporarily sealed so as to prevent silt, construction
materials or debris being washed into the drainage system and storm runoff being
directed into foul sewers.
��
The precautions to be taken
at any time of year when rainstorms are likely together with the actions to be taken
when a rainstorm is imminent or forecasted and actions to be taken during or after
rainstorms are summarised in Appendix A2 of ProPECC
PN 1/94.
��
All vehicles and plant should be cleaned before leaving
a construction site to ensure no earth, mud, debris and the like is deposited by
them on roads. An adequately designed
and sited wheel washing facilities should be provided at
every construction site exit where practicable. Wash-water should have sand and silt settled
out and removed at least on a weekly basis to ensure the continued efficiency of
the process. The section of access road
leading to, and exiting from, the wheel-wash bay to the public road should be paved
with sufficient backfall toward
the wheel-wash bay to prevent vehicle tracking of soil and silty
water to public roads and drains.
��
Construction solid waste, debris and rubbish on site should
be collected, handled and disposed of properly to avoid water quality impacts.
��
Appropriate numbers of
chemical toilets will be provided by a licensed contractor to serve the construction
workers over the construction sites to prevent direct disposal of sewage into the
water environment. No onsite discharge
from these chemical toilets will be allowed.
��
All fuel tanks and chemical storage areas will be provided with locks and be sited on sealed
areas. The storage areas will be surrounded
by bunds with a capacity equal to 110% of the storage capacity of the largest tank.
��
The contractors shall ensure that leakages or spillages are contained
and cleaned up immediately.
5.9.2
Operational Phase
5.9.2.1 Maintenance dredging will be carried out to allow vessels to access the marine
facilities at low tide and to enhance navigational safety. Cage type silt curtain will be provided during
maintenance dredging. The maximum working rate for maintenance dredging is assumed to
be 40 m3 per hour and only one closed grab dredger will be working
in any time. Other good site practices
stipulated under Section 5.9.1 for marine
construction works would be applicable for maintenance dredging during operational
phase as well.
5.9.2.2 Local
connections to the public sewer would be installed and no direct discharge of
sewage and wastewater to the nearby drainage system and marine waters would be allowed. Regular cleaning and removal of floating
refuse should be conducted within the area of the marine facilities and coastal area around the Project to
avoid excessive accumulation. Also, any new drainage outfall(s) under this Project will be
located outside of the marine facilities.
5.9.2.3 Spillage
clean up equipment should be provided at the marine facilities to allow quick
response in case of emergency.
5.9.2.4 A surface water drainage
system should be provided to collect road runoff to the new
drainage system with new stormwater outfall and adequate designed pollution
removal devices such as silt trap and oil/grease trap, as necessary, which
should be regularly cleaned and maintained to ensure proper functioning.
5.10.1.1 There are a few concurrent projects that could have significant effect on flow regime and sediment
elevation within the NWWCZ. They are
listed in the Working Paper on Water
Quality Modelling Plan (Appendix 5.1) and summarized
in Table 5.21 below.
Table 5.21 Concurrent
Projects Considered in this Water Quality Impact Assessment
|
|
Concurrent Projects
|
Marine Works
Involved
|
Consideration
in this Water Quality Impact Assessment
|
|
1
|
Expansion of Hong Kong International Airport into a Three-Runway System
|
Majority of reclamation works has been
completed by mid-2021
|
Completed reclamation was taken into account in the hydrodynamic modelling in this EIA
to account for its effect on flow regime. Other discharges from 3RS operation and
seawater intakes WSRs were also taken into account.
|
|
2
|
Tung Chung New Town Extension
|
Reclamation works was completed by
2022
|
Reclamation was taken
into account for the operational phase assessment in this EIA for cumulative
assessment. Seawater intakes WSRs
were considered as well.
|
|
3
|
Tung Chung Line Extension
|
No marine work under this project
|
No reclamation and proposed discharge
of cooling water or other major effluent for this project. No notable cumulative impact from this
project is anticipated in terms of water quality.
|
|
4
|
SkyPier Terminal (SPT) Bonded Bridge (formerly known as Intermodal Transfer Terminal
- Bonded Vehicular Bridge and Associated Roads)
|
Bridge piles installation has been
completed on July 2022
|
Footprint
of the piles and the effect of the presence of the bridge piles were taken into account in the operational phase hydrodynamic modelling
for cumulative assessment.
|
|
5
|
Airportcity Link (formerly known as Airport City Link)
|
Bridge piles installation to be completed
by 2024
|
|
6
|
SKYCITY
|
No marine work under this project
|
Sewage and wastewater will be
discharged into local sewerage network and no direct discharge of sewage or
wastewater is expected from this project. No notable cumulative impact from this
project is anticipated in terms of water quality.
|
|
7
|
East Coast Support Area
|
No marine work under this project
|
No notable cumulative impact from this
project is anticipated in terms of water quality.
|
|
8
|
Potential Reclamation Site at Lung Kwu Tan
|
The proposed reclamation is currently
being studied by CEDD and there is no clear implementation schedule
|
The reclamation area was taken into account
in the operational phase modelling assessment for change in flow regime. While these are Designated Projects
under EIAO, the project proponents will need to carry out EIAs and carry out
necessary measures to confine the sediment loss arising from the
dredging/marine works. It is anticipated
that there will be limited level of cumulative SS elevation from the construction
of this Project. Therefore, sediment loss from this Project
was not taken into account in the sediment dispersion
modelling assessment for maintenance dredging.
Note that these projects are designated projects under the EIAO and
separate assessment on cumulative impact arising project this Project would
be conducted in the respective EIAs.
|
|
9
|
Potential Reclamation Site at Sunny Bay
|
The proposed reclamation is currently
being studied by CEDD and there is no clear implementation schedule
|
|
10
|
Contaminated Mud Disposal Facilities at East of Sha Chau and South Brothers
|
It is expected the capacity of this
facilities will be exhausted by 2027 and disposal will be stopped by then. Capping of pits will be followed soon. It is unlikely that there will be significant
overlapping for the sediment disposal and capping under at the CMP and the maintenance
dredging under this EIA given the completion of marine facilities under this
Project would be by Q4 of 2027.
|
The final capped level at the East of Sha Chau and South Brothers Contaminated
Mud Pit was taken into account in the hydrodynamic modelling to assess the
change in flow regime.
|
|
11
|
Road P1 (Tai O �C Sunny Bay Section)
|
Project is in its EIA stage and no detail project programme is available yet. According to it project profile,
project construction is targeted to be completed by 2030. Marine reclamation is expected to
create a thin stripe of land at Siu Ho Wan.
|
The reclamation area was taken
into account
in the operational phase modelling assessment for change in flow regime. It is anticipated that there will be
limited level of cumulative SS elevation from the construction of this Project given its separation (> 4 km
plus HKP in between). Therefore,
sediment loss from this Project was not taken into account
in the sediment dispersion modelling assessment for maintenance dredging.
|
5.11.1
Construction Phase
5.11.1.1
Marine construction works under this Project and the generation
of wastewater and sewage from workforce have been assessed. No unacceptable water quality impact from
marine-based construction works is expected.
5.11.1.2
With the implementation of standard site practices and
control measures specified under Section
5.9.1, no unacceptable water quality impact is expected from the proposed land-based
construction works.
5.11.2
Operational Phase
5.11.2.1
Change in flow regime due to presence of both floating structure and
berth piles at the embayment between Airport Island and HKP Island, as well as
the marine viaduct piers at the Tung Chung Navigation Channel has been evaluated. No unacceptable
change in flow regime outside of the embayment is expected from the operation of the proposed marine facilities.
5.11.2.2
In addition, sediment dispersion modelling indicated there
would be limited changes in water quality for maintenance dredging with controlled
work rate of 40 m3 hr-1 and the use of cage type silt curtain
around grab dredger, therefore no unacceptable water quality impact would be expected.
5.11.2.3
Other sources i.e. discharge of wastewater and sewage effluent
from staff and visitors and potential oil spillage associated with the operation
of the vessels have been evaluated.
No unacceptable water quality impact would be expected from these sources.
5.12.1.1
Marine water quality monitoring at
representative locations is recommended for marine works for the marine viaduct and marine facilities
during construction phase and maintenance dredging during operational phase.
Weekly site audits would also be conducted throughout the marine-based
construction under this Project. The
specific monitoring requirements are detailed in the standalone Environmental
Monitoring and Audit (EM&A) Manual.
5.13.1
Construction Phase
5.13.1.1
Potential water quality impact from marine and land-based
construction works under the Project and the generation of wastewater and sewage
from workforce have been assessed in this EIA. Appropriate
preventive and mitigation measures are recommended to minimise the potential water
quality impact from these activities.
Unacceptable water quality impact from the construction
works under the Project and sewage discharge is not expected.
5.13.2
Operational Phase
5.13.2.1
Computational modelling has been conducted to assess the potential
change in flow regime due to the presence of piles and wave attenuator for marine
facilities, as well as the marine viaduct at the Tung Chung Navigation Channel to
be constructed under this Project. No
unacceptable change in flow regime would be expected from
the Project. In addition,
various potential water quality impacts from the operational phase maintenance dredging,
including SS elevation, sedimentation, DO depletion, release of sediment-bounded
nutrient, heavy metal and organic contaminants have been assessed in this EIA. Unacceptable water quality impact from maintenance
dredging is not expected.
5.13.2.2
The potential water quality impact arising associated with the
sewage and wastewater generated from workforce, depot operation and potential oil
spillage from the operation of the marine vessels has been assessed. Appropriate preventive and mitigation measures
are recommended to minimise the potential water quality impact from these activities. Unacceptable water quality impact from these
activities is not expected.